In our blogpost detailing Prophet Arena's submission guidelines for a model or agent to be featured on our leaderboard, we specified that leaderboard results for that model will not be displayed until at least 10 days after a new event's introduction.
This waiting period is designed to reduce large post-launch fluctuations in leaderboard rankings, while still ensuring that results are made available in a timely manner. In this post, we present a statistical analysis based on historical leaderboard data that motivates the adoption of a 10-day evaluation window.
Defining Stability
To determine whether a model's predictive performance has "stabilized," we looked at the model's cumulative average Brier score over the number of predicted events and over time. As the number of predicted events increases, the cumulative average Brier score eventually stabilizes to around the long-run mean Brier score of that model. See some examples from OpenAI's GPT-5, xAI's Grok-4, Google's Gemini 2.0 Flash, and Anthropic's Claude Opus 4.1 models below.
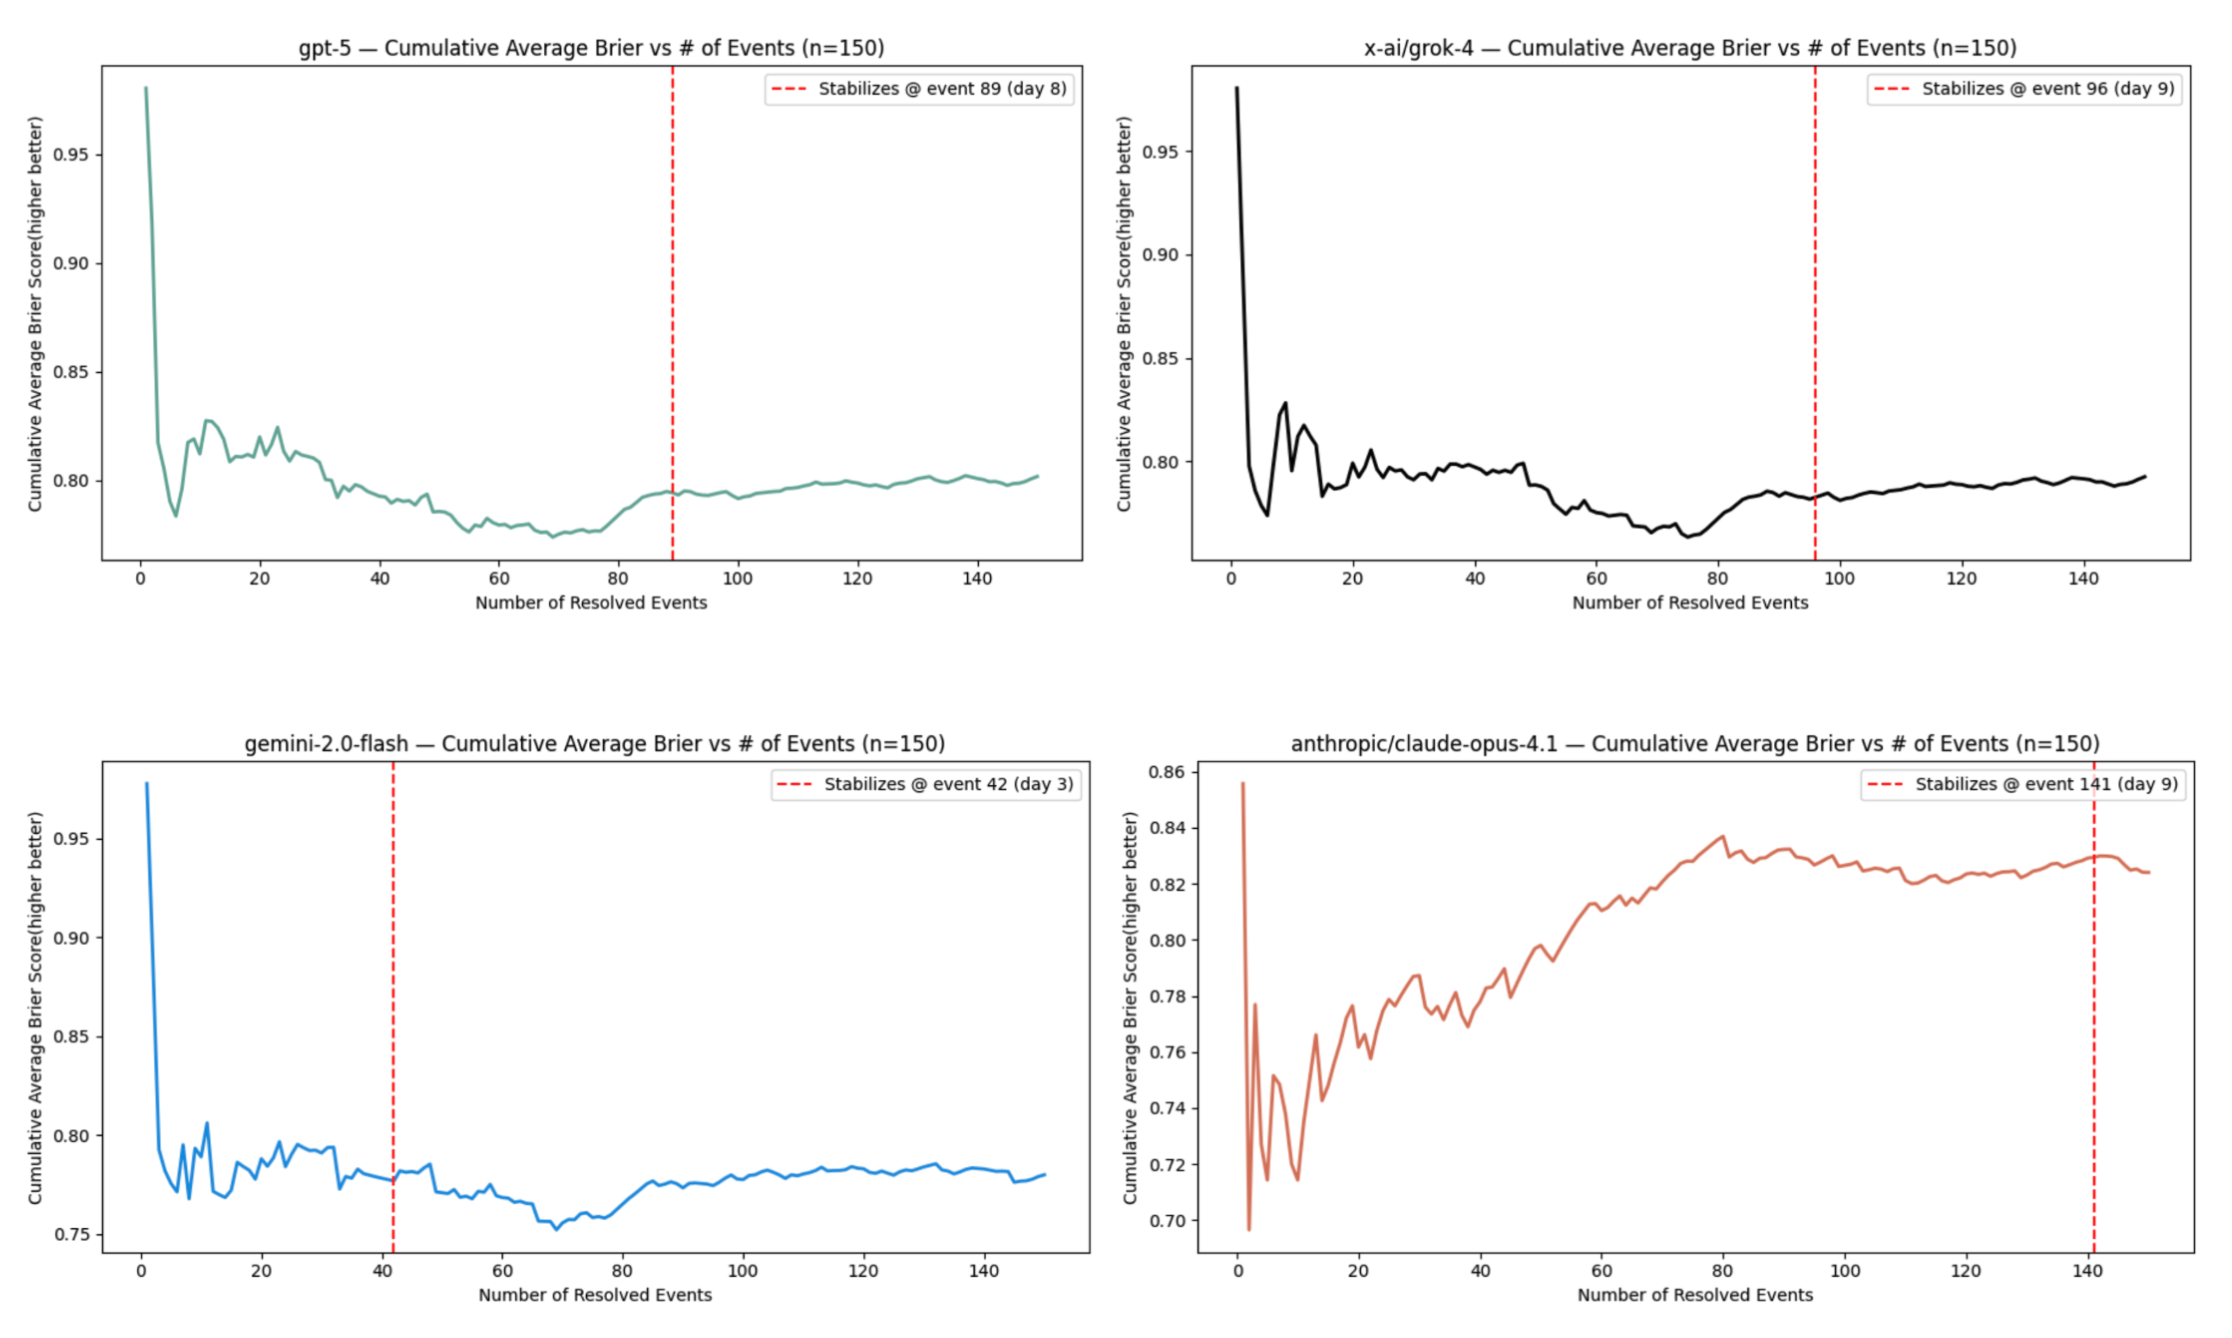
The most noticeable trend here is that there's a fair amount of volatility in the cumulative average for the first few forecasts each model makes, but as more and more events are resolved, there's a lot less event-to-event change in the cumulative average. Intuitively, this makes sense, as the variance of the cumulative average should decrease in the limit of the number of predicted events.
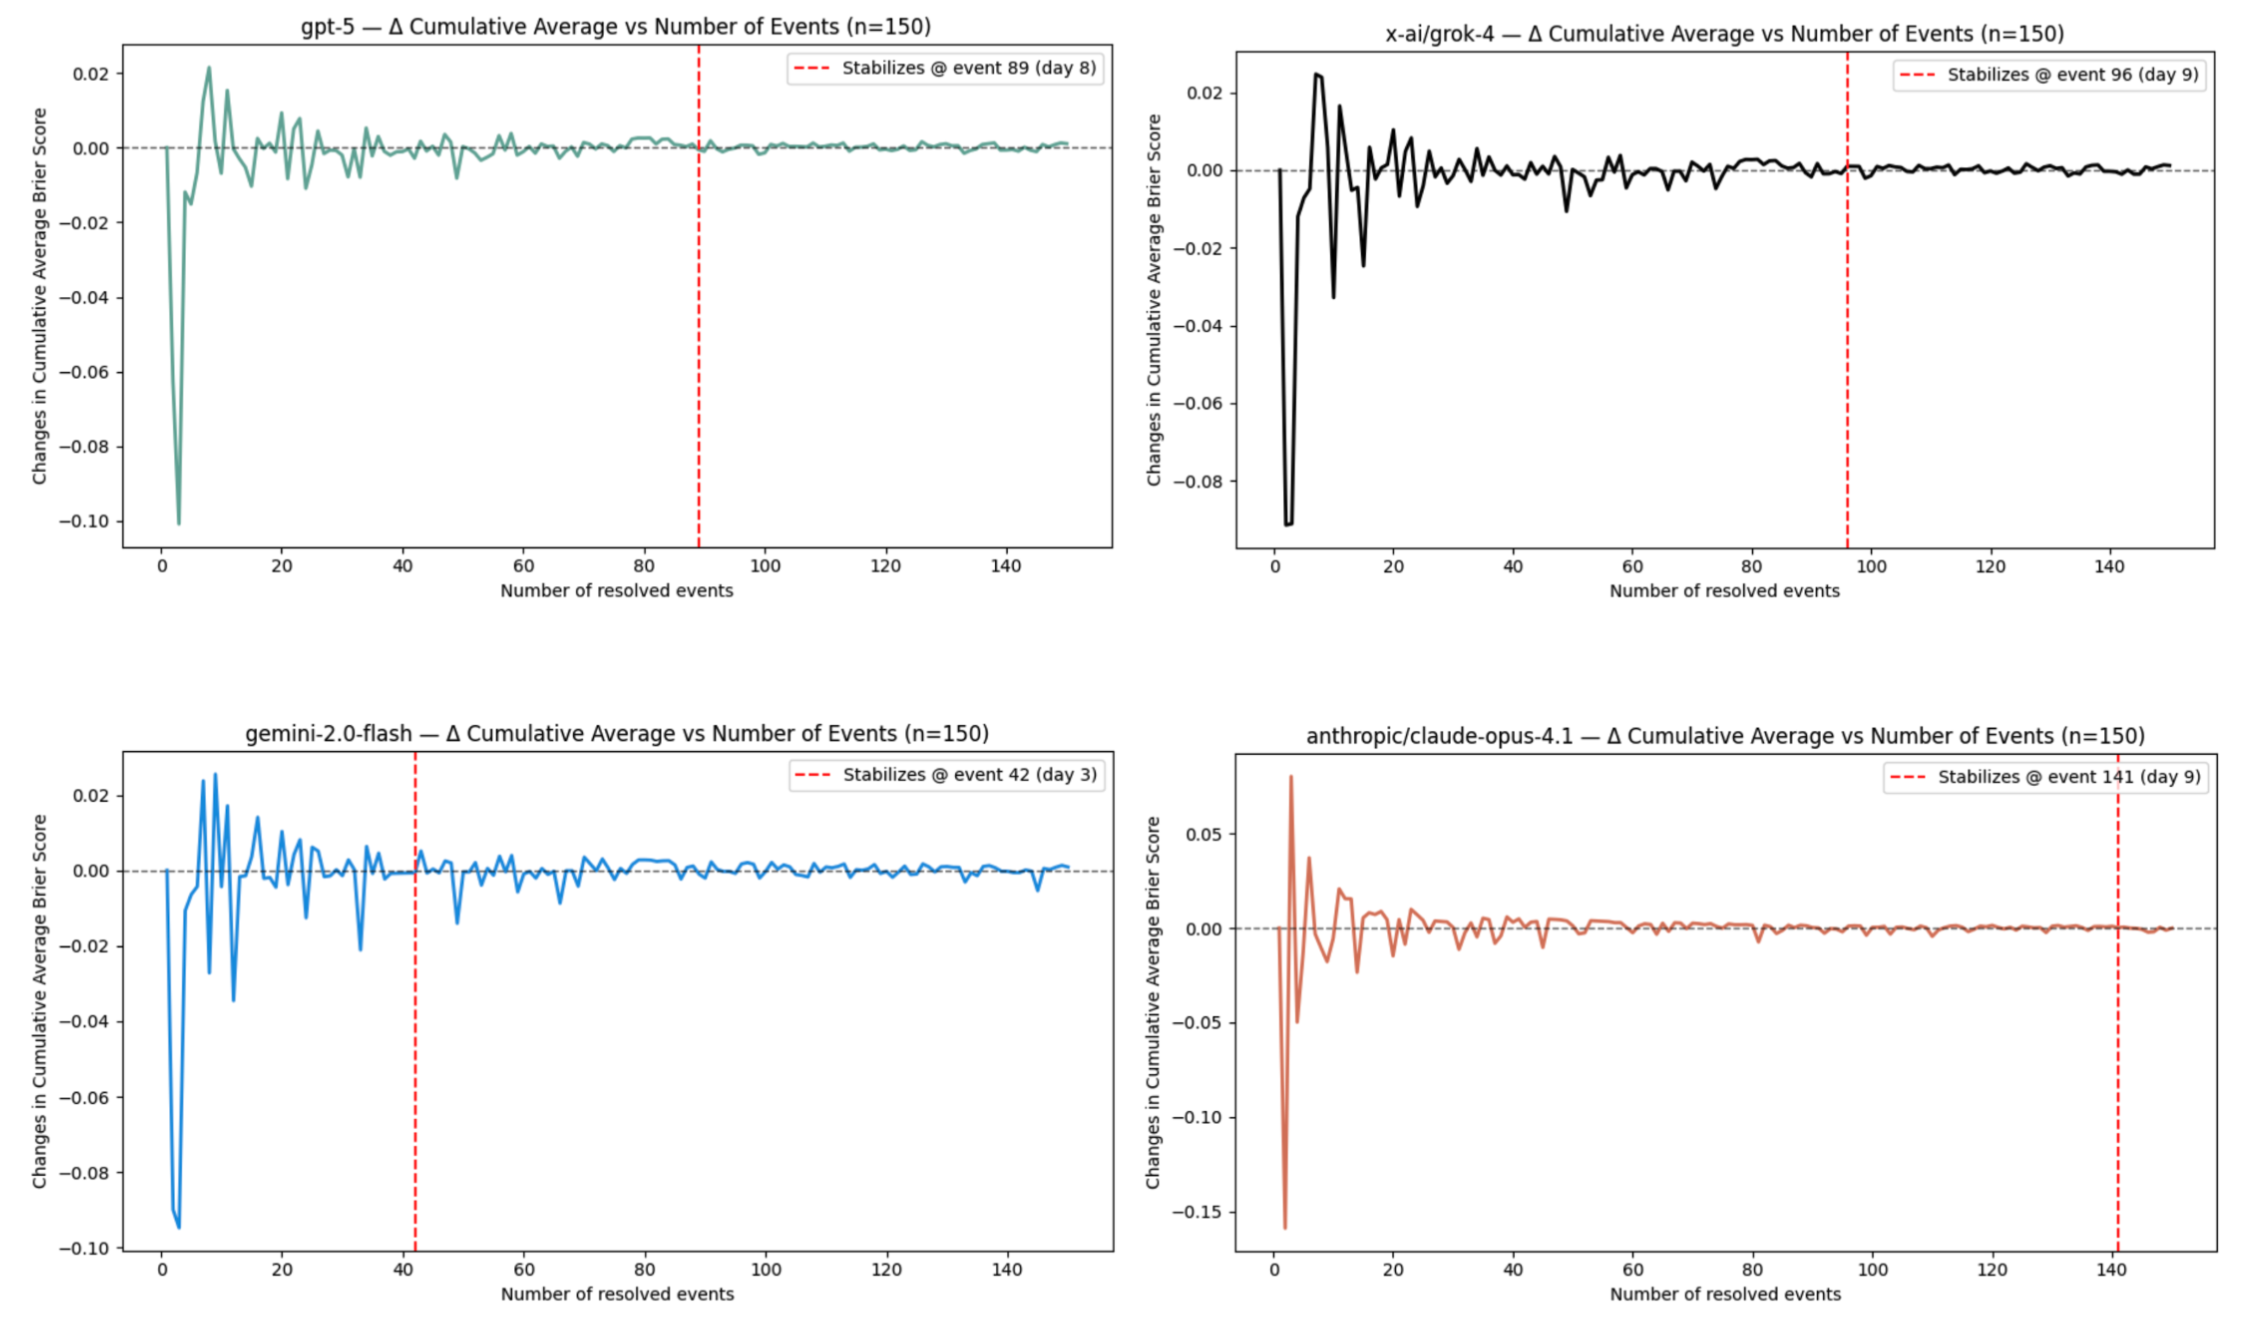
Naturally, this lends itself to an idea of volatility based on the differences in cumulative average Brier score between events.
As such, we choose a sufficiently small threshold and declare stability when the absolute change in cumulative average Brier falls below it for a short run of events; specifically, we use ε = 0.001 and mark a model as "stable" at the first event t where |ΔCumulative Average(t)| < ε for K = 5 consecutive events, then map that event index to calendar days to report the time-to-stability.
We plotted the differences in cumulative average Brier score between adjacent events across the three aforementioned models – which stabilize to around 0 for many predicted events – and mark the corresponding number of days since each model made its first prediction.
One caveat of this approach is that a model can be either gradually increasing or decreasing in its forecasting performance, but still look "stable." While this approach of defining stability tells us the model's cumulative performance isn't changing much by event t, it makes no guarantee on the actual level of the cumulative performance. Since we choose a very conservative threshold of ε = 0.001, however, any increase or decrease would have to be exceedingly small, making this of minimal concern.
Additionally, this approach only determines a model is stable by the first sequence of forecasted events that have consecutive differences below our ε = 0.001 threshold. It's possible for a model's cumulative average Brier score to be stable early on, and then experience fluctuations that exceed the threshold later (Gemini-2.0 Flash exemplifies this phenomenon). In practice, this concern is small, as (1) we are looking for a sufficiently minimal signal for stability, upon which we can reasonably determine that a model's future updates are very unlikely to swing the average by much as more outcomes resolve, and (2) as the number of forecasted events continues to increase, the event-to-event changes in cumulative average performance increasingly approach 0. Ultimately, our goal is to balance ensuring that a model's leaderboard performance is sufficiently stable against minimizing the delay before participants can see their results on the benchmark.
Time-to-Stability
We opted to select a time-based cutoff rather than an event-based cutoff for our submission guidelines. We felt that defining a specific time frame at which participants could expect to see their model featured on our leaderboard was more transparent and consistent than a guideline based on the number of events forecasted, which are more variable over time.
In order to mimic the process of participants submitting a model and waiting a certain number of days for their model's performance to stabilize, we used historical data of model submissions, marked when each model made its first prediction on our leaderboard, and tracked the cumulative average Brier score of each model in the order that forecasted events resolved, flagging the first day on which the model's cumulative performance exhibited K = 5 consecutive event-to-event changes smaller than ε = 0.001; this day became our empirical "time-to-stability" cutoff for leaderboard inclusion.
Across all leaderboard models, we found that the median time-to-stability was around 7 days (corresponding to just under 100 events), with 75% of models becoming stable within 9 days and 95% of models becoming stable within 10 days.
Sensitivity Analysis and Backtesting
One potential concern is that defining time-to-stability using changes between adjacent cumulative average Brier score estimates may be sensitive to the timing of a model's initial submission. A model that begins forecasting during a period dominated by inherently uncertain events – for example, political outcomes – may exhibit higher short-term volatility than a model whose early predictions involve more predictable events, such as sports. As a result, early fluctuations may reflect the composition of events rather than intrinsic model behavior.
To ensure robustness to such start-date effects, we backtested time-to-stability by repeatedly re-running the stabilization analysis from different historical start dates. In each run, we treated a later prediction as the model's effective "launch" and measured how long it took to stabilize from that point. We then summarized these results across all start dates and all models to understand the typical and worst-case stabilization times.
As an example, we visualized the distribution of time-to-stability for xAI's Grok-4 under our backtesting strategy, where each computed time-to-stability statistic comes from treating a different event as the official start date.
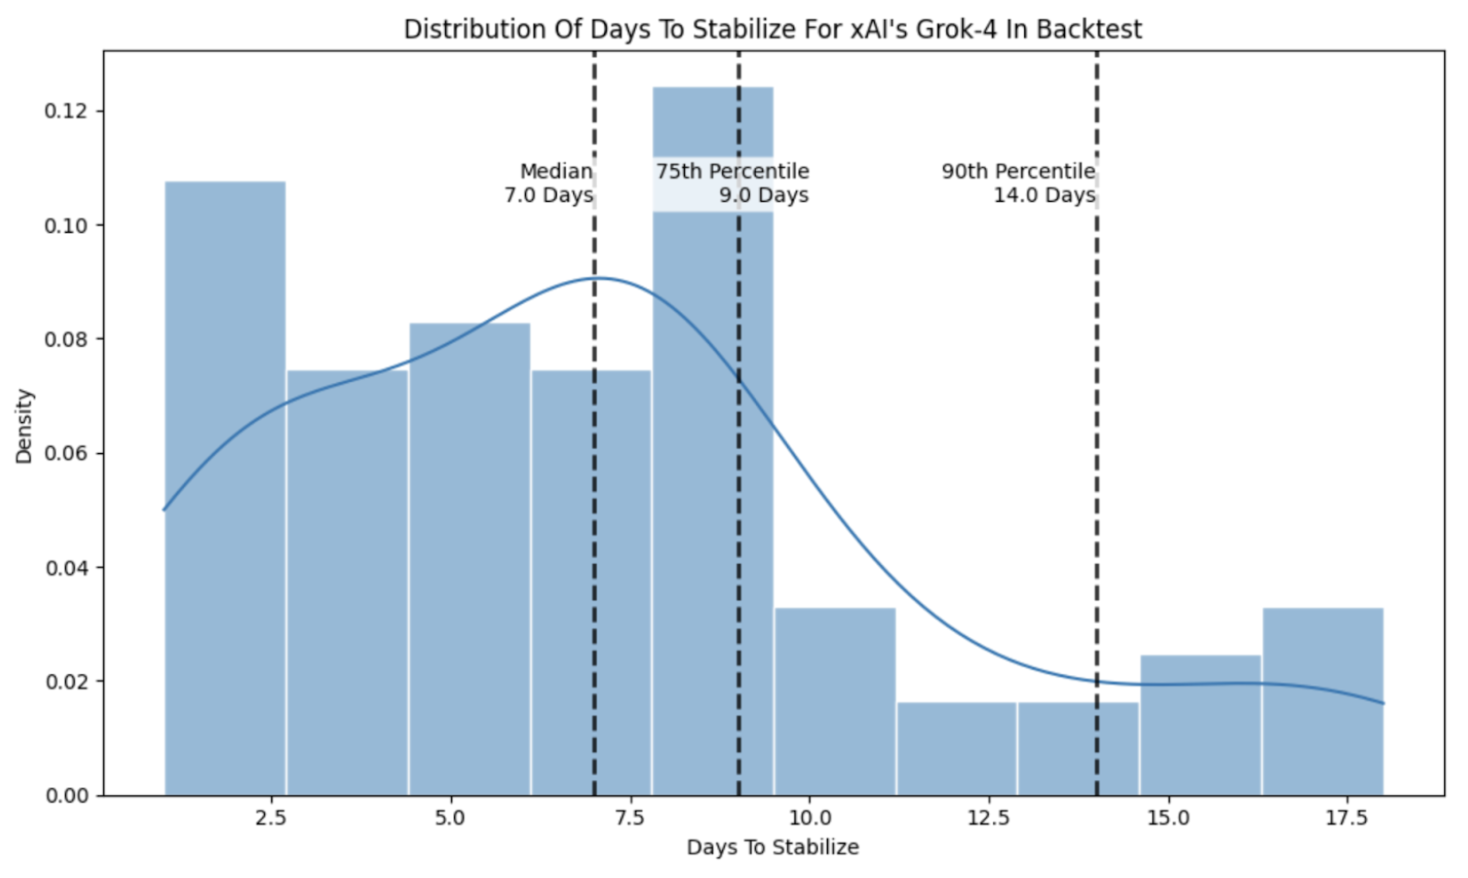
Across all models in our backtest, the median time-to-stability was approximately 7 days, with the 75th percentile of time-to-stability being 10 days and the 90th percentile being 16 days.
Choosing 10 days
Based on both historical performance and our start-date sensitivity analysis, a 10-day waiting period represents a reasonable compromise: it is long enough that the vast majority of models have entered a stable performance regime, while still short enough to avoid unnecessary delays in surfacing results to participants.
More broadly, this approach reflects our commitment to designing a leaderboard that is both statistically rigorous and participant-friendly. By grounding our submission guidelines in empirical evidence and stress-testing them against real-world variation, we aim to ensure that models are evaluated fairly, that the criteria for inclusion are transparent, and that performance is measured consistently across all participants. As Prophet Arena continues to evolve, we will continue to revisit and refine these guidelines as more data becomes available and as forecasting behavior on the platform changes.