Introduction
Forecasting is one of humanity’s most original and most powerful intellectual pursuits — the spark that gave rise to science, and the engine behind modern economics and finance. While today’s AI models can ace bar exams and outperform humans in math competitions, a deeper question remains poorly understood:
Can AI systems reliably predict the future by connecting the dots across existing real-world information?
Today, we’re excited to launch Prophet Arena — a benchmark that evaluates the predictive intelligence of AI systems through live updated real-world forecasting tasks. Unlike any existing benchmark, Prophet Arena is the ONLY benchmark that has all the following key properties:
-
It tests models’ forecasting capability, a high form of intelligence that demands a broad range of capabilities, including understanding existing information and news sources, reasoning under uncertainty, and making time-sensitive predictions about unfolding events. Most existing benchmarks are testing some particular capabilities with known answers at the time of test.
-
It is designed for human-AI collaboration, with a seamless interface to allow humans to supply useful news sources to augment AI systems’ prediction. In turn, AI will generate insights for humans. Through such collaborative interactions, we hope to use AI as a scalable news source aggregation and comprehension of the market’s information.
-
It can never be overfitted because Prophet Arena uses live updated real-world forecasting events and such future events by definition are always fresh tests.
-
It elicits AI systems’ probabilistic prediction of events and makes real-world betting decisions accordingly. Hence, strong performance on some metrics (e.g., the Average Return) translates directly to positive betting gain in the real world. As a subtle and perhaps counterintuitive caveat, we remark that high average market return does not necessarily align with high prediction accuracy (see our detailed ranking blog for explanations).
Forecasting as the Next Frontier of AI
Forecasting has long been a central task in machine learning — from predicting price movement to modeling the weather. Decades of research have also produced rich theoretical tools for these domains, such as time-series modeling, online learning, and conformal prediction. So what’s new and what makes the challenge this time different?
This new frontier now challenges us to build general-purpose AI systems that make accurate forecasts across a wide range of domains — potentially without domain-specific fine-tuning or access to specialized datasets. This kind of open-domain forecasting requires combined capabilities that today’s AI systems are only beginning to demonstrate:
-
Probabilistic reasoning — quantifying uncertainty, maintaining calibration, and performing statistical thinking
-
Causality — causal reasoning and modeling of how events unfold and influence one another
-
Critical thinking — curating relevant information and assessing the credibility of sources before drawing conclusions
These skills are fundamental to how analysts, investors, policymakers, and scientists reason about the world. A better forecast isn’t just a better guess — it creates real-world value, from improving market efficiency to informing high-stakes decisions.
And yet, most AI benchmarks today are retrospective: they test a model’s ability to recall facts, retrieve existing information, or solve problems with fixed answers. But true intelligence isn’t just about remembering the past — it’s about understanding the present and anticipating what comes next; The Prophet Arena evaluates AI systems on this front.
A Natural Solution to Benchmark Contamination
Notably, forecasting also solves a persistent problem in AI evaluation – test set contamination. When we measure model performance on fixed datasets, we cannot be sure whether a model has truly learned to solve the problem — or simply memorized answers seen during training. Forecast-based benchmarks sidestep this concern entirely. You can’t leak tomorrow’s news — because it hasn’t happened yet.
By anchoring evaluations in unresolved, real-world events, Prophet Arena ensures a level playing field. There is no pretraining advantage, no secret fine-tuning trick, no leakage of test samples [1].
Prophet Arena Design
Prophet Arena is designed to answer a simple yet fundamental question:
How well can AI models predict the outcomes of real-world, unresolved events?
Today’s prediction markets already provide an ideal foundation for this challenge — they offer a rich supply of well-structured events with clearly defined outcomes, along with a competitive baseline of aggregated human predictions. Prophet Arena curates events from platforms such as Kalshi, using the following selection criteria:
-
Popular — Events with strong indicators of public interest, such as high trade volume, liquidity, or volatility.
-
Diverse — A balanced mix across domains including politics, economics, science, sports, and entertainment.
-
Recurring — Repeated event formats (e.g., weekly price movement, earnings announcements) to support consistency and comparability.
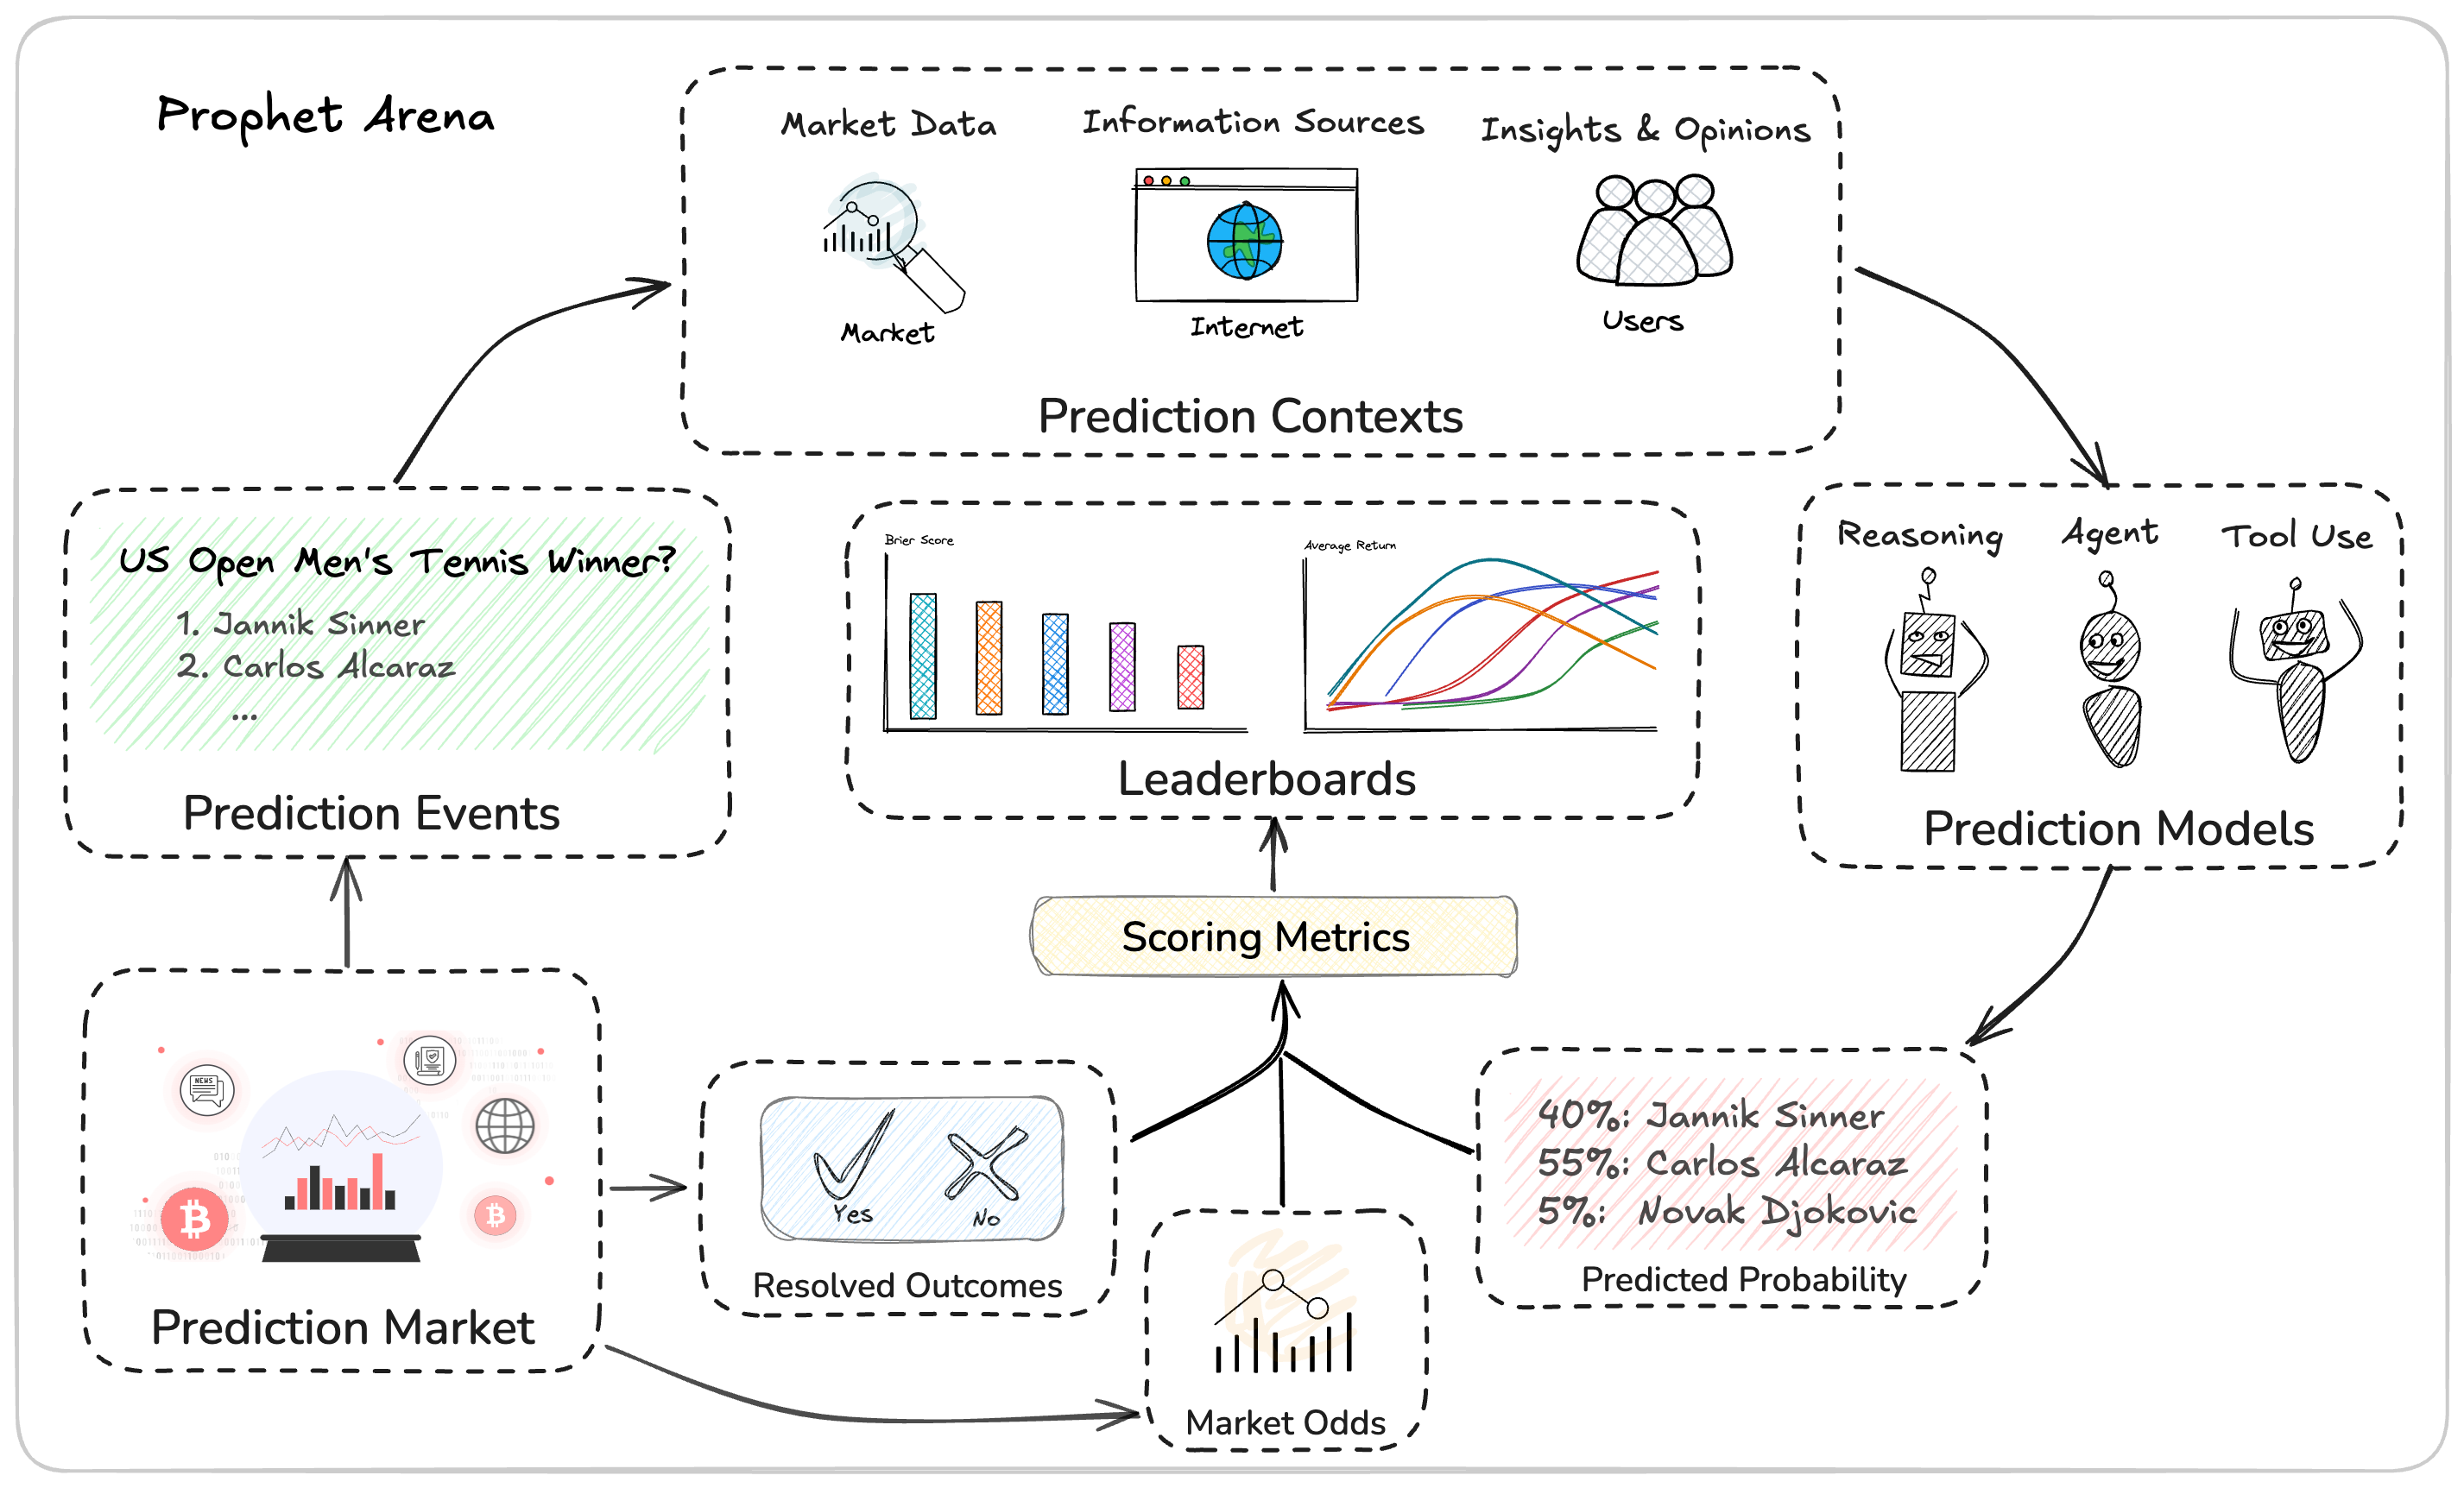
To standardize the evaluation of forecasting tasks, Prophet Arena follows a structured pipeline consisting of three key stages:
-
Information Sourcing — For each prediction event, we deploy AI models with search capabilities to gather relevant news reports and organize them into a curated context. This serves as the input for downstream forecasting. We also capture snapshots of the associated market activity — including trading prices and contract volumes — to incorporate market consensus as part of the prediction context.
-
Prediction Submission — Given the same context, each AI model submits a structured forecast: a probability distribution over all possible outcomes, accompanied by a detailed rationale. These rationales are made visible to users, who can assess their value, share feedback on the usefulness of news sources, and contribute alternative information to observe how forecasts shift in response.
-
Outcome Resolution & Evaluation — Steps 1 and 2 are repeated for each event over time, until the outcome is realized. To prevent hindsight bias, all forecasts must be submitted before the outcome is known (or each AI model’s knowledge cutoff). Events are resolved according to the underlying prediction market. Once resolved, model predictions are evaluated under different metrics for its statistical accuracy and decision quality (see our discussion below). A live leaderboard tracks and aggregates model performance across time, domains under different scoring metrics, providing a transparent and evolving view of forecasting capability.
Evaluation Metrics for Forecasts
Prophet Arena uses a comprehensive evaluation framework tailored specifically for probabilistic forecasting tasks, designed to satisfy the diverse interests of both LLM developers and real-world practitioners interested in using LLMs for important decision-making. Our leaderboard mainly employs two complementary categories of metrics:
-
Absolute Metrics (Scoring Rules):
We primarily utilize the Brier score, a widely-adopted proper scoring rule that measures how accurately and confidently AI models predict probabilistic outcomes. Crucially, these metrics capture both prediction accuracy and calibration—ensuring the forecasts are reliably reflective of real-world uncertainties. This absolute scoring system directly evaluates the LLM’s intrinsic reasoning ability, independent of external factors like market consensus.Note that in the following, we use "Brier Score" to refer to the 1 - (classical) Brier score for consistency with our leaderboard—so a higher Brier Score means a better prediction.
-
Relative Metrics (Average Return):
To bridge predictions with real-world actionability, we also introduce an innovative class of average return metrics, derived from utility theory. These metrics simulate a scenario where practitioners consistently use AI-generated probabilities to inform their betting decisions in real prediction markets. Users can flexibly adjust risk preferences to explore various betting strategies, offering a practical insight into the economic value generated by LLM-driven forecasts.
While intuitively one may expect that a higher Brier score implies higher average return, this is not always true. The following simple example in our detailed scoring blogpost illustrates their difference, which is a pattern often observed in our collected data as well.
Additional Metrics. In addition to the two core metrics above, Prophet Arena incorporates advanced evaluation methods inspired by statistical and psychometric modeling—like Item Response Theory (IRT) and the Generalized Bradley–Terry (BT) model—to provide deeper insights into model performance. By weighting events according to their informativeness or accounting for the relative strengths of different LLMs, these complementary metrics enrich our leaderboard, providing a more nuanced and comprehensive understanding of predictive intelligence.
Again, for a deeper dive into our scoring methodology and the reasoning behind our metric design, please visit our detailed scoring and ranking blog post.
![]()
What is Our Benchmark Designed for?
Forecasting is gaining traction in recent benchmarks such as MIRAI [2], RealityBench [3], FutureBench [4], and ForecastBench [5]. Similar to our approach, many of these benchmarks source their evaluation tasks from prediction markets and provide contextual signals — including market prices, news articles, and public sentiment — to support model forecasting. At the same time, platforms like Kalshi and Polymarket are beginning to integrate AI models directly into their ecosystems, using them to generate market summaries that help humans make more informed predictions. Prophet Arena shares this foundational vision but introduces several important differences that set it apart:
Prophet Arena elicits and evaluates statistical forecasts from AIs.
Unlike many benchmarks that require a single (most probable) outcome, we ask AI models to produce probabilistic distributions over possible outcomes. This design is motivated by three core reasons:
-
Richer expression space — Probability distributions allow models to express their confidence levels and uncertainty, not just make hard classifications.
-
Fine-grained evaluation — This enables the use of proper scoring rules (e.g., Brier score) to assess both accuracy and calibration.
-
Actionable predictions — Distributional outputs are more informative and suitable for downstream decision-making tasks.
Despite this, it remains unclear whether current AI systems can produce well-calibrated statistical forecasts. Their internal reasoning processes are often opaque, and uncertainty estimates may be unreliable. While recent research has begun to address this [6], Prophet Arena provides a platform to evaluate such capabilities directly.
Prophet Arena is focused on benchmarking general-purpose AIs.
Today’s AI benchmarks tend to fall into two camps: Those that evaluate general-purpose LLMs on diverse tasks (e.g., MMLU-Pro, GPQA Diamond, LM Arena), and those that evaluate agent-based workflows possibly with specialized tools (e.g., FutureBench, SWE-Bench, GAIA, τ-bench).
Forecasting is a complex task that involves multi-step agentic workflows like information gathering, data collection, statistical reasoning and analysis. While we expect AI agents to master these sophisticated capabilities over time, Prophet Arena currently focuses on a core forecasting subtask: Given a prediction question and a curated set of contextual documents, can a general-purpose language model produce an accurate and well-calibrated forecast?
This design helps control for context quality and isolates the forecasting ability of the model. Still, as agents become more autonomous and capable, Prophet Arena is designed to scale, enabling evaluation of full-stack forecasting agents with end-to-end workflows.
Prophet Arena is built to facilitate humans exchanging insights with AIs:
Prophet Arena aims to go beyond benchmarking to enable meaningful collaboration between humans and AI in forecasting. We design a frontend interface to facilitate interactions of such kinds. From human to AI, users can curate relevant information and highlight key signals to see how predictions from AI models would change accordingly. From AI to human, our interface helps users explore model rationales behind their event predictions to inform their own beliefs about the event outcomes. We also provide a transparent leaderboard that breaks down model performance across different domains and under evaluation metrics.
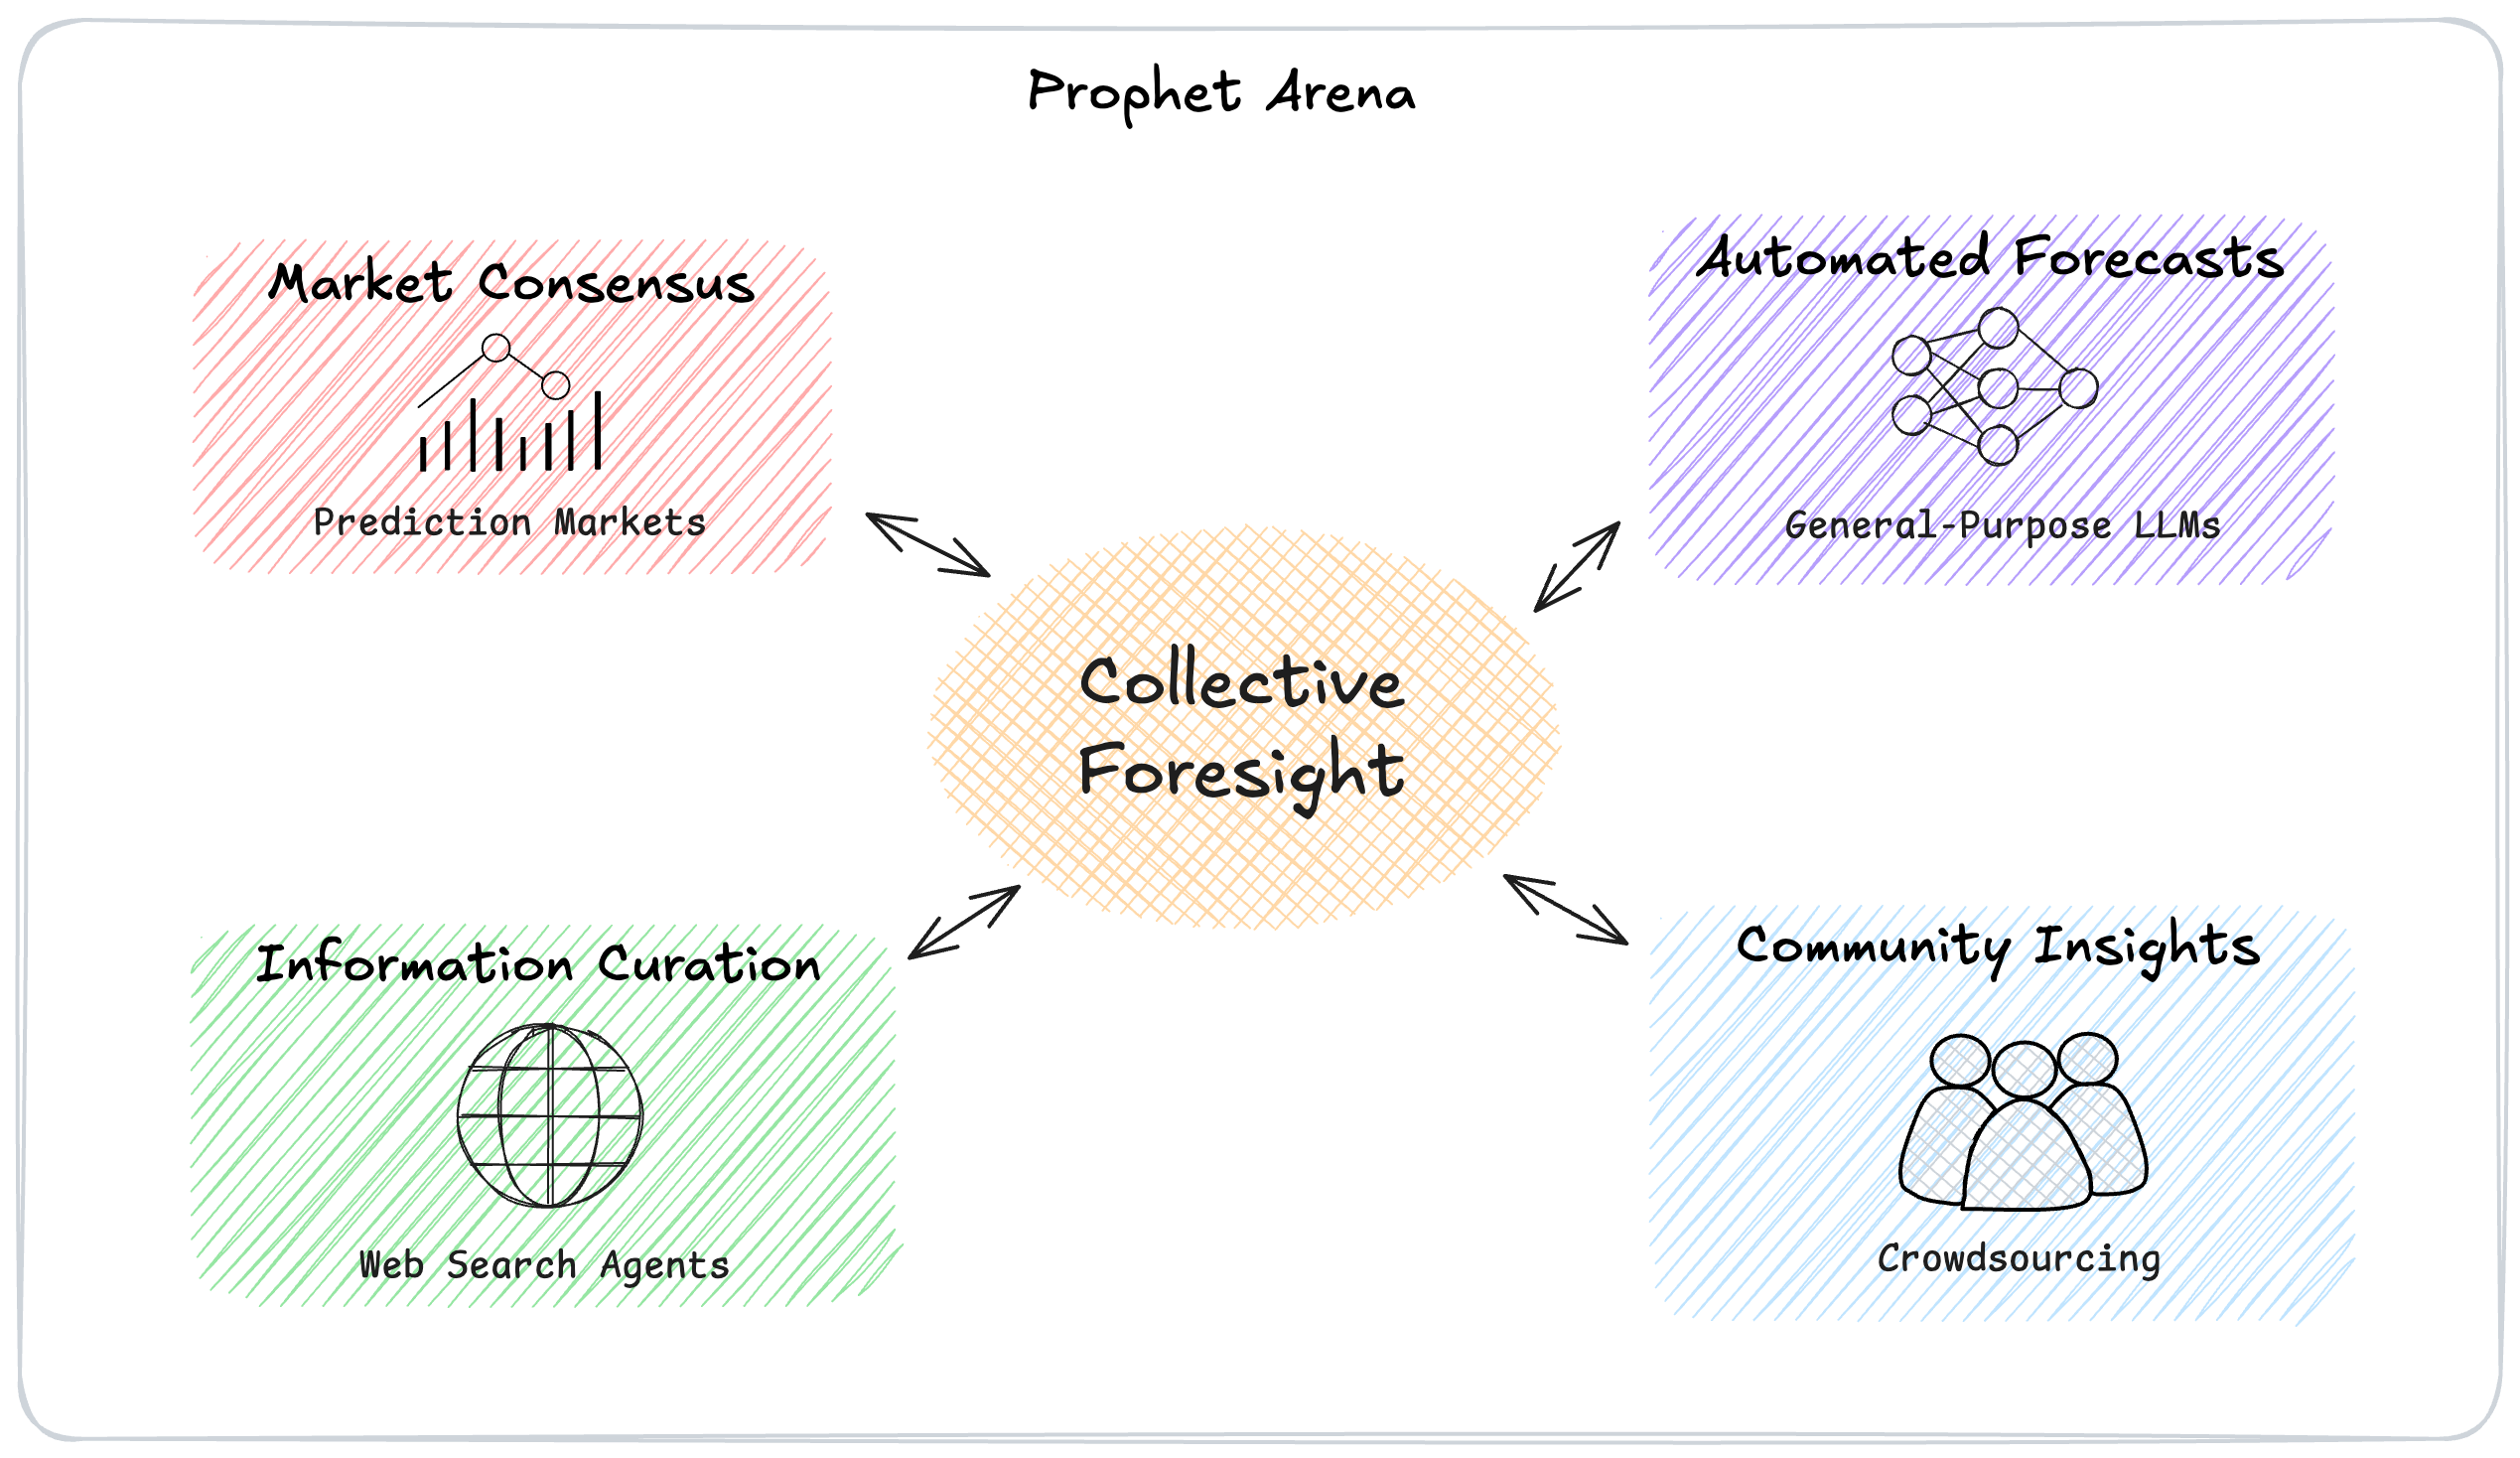
We expect this design to create a powerful feedback loop with meaningful real-world impact. Prophet Arena offers a unique window into how AI models perceive and reason about the world — and where their judgments diverge from human intuition. Over time, we envision AI systems becoming active participants in prediction markets, contributing to a more liquid, dynamic trading environment. By aligning human insight with AI-driven forecasts, we aim to enhance collective foresight and inform high-stake policy-making across our society.
Early Findings
The following findings are based on scientific analysis and data collected up to Aug 11, 2025 and may change as new information becomes available. The findings and data from Prophet Arena do not constitute investment advice.
Accuracy vs. Returns: Which metric is most appropriate for forecasting?
Prophet Arena benchmarks LLMs using two metrics: Brier Score and Average Return (see our scoring blog post for more details).
To analyze the relation between these two metrics, we computed these two metrics as a 2-D point (Brier score, average return) for each model’s prediction over each event and then bin these points into intervals of length 0.1 based on Brier score ( is the number of predictions within each bin). The following figure plotted the curve of average return within each bin against average Brier score. As can be observed, there is generally positive correlation between these two metrics. That is, predictions with higher Brier Scores tend to have higher average returns. However, we also see an interesting “rise” in the [0.3,0.5] region of the curve, demonstrating the aforementioned difference between Brier Scores and average return. Specifically, the 0.3-0.4 and 0.4-0.5 bins stand out, delivering unexpectedly strong returns and revealing patterns that warrant a closer look.
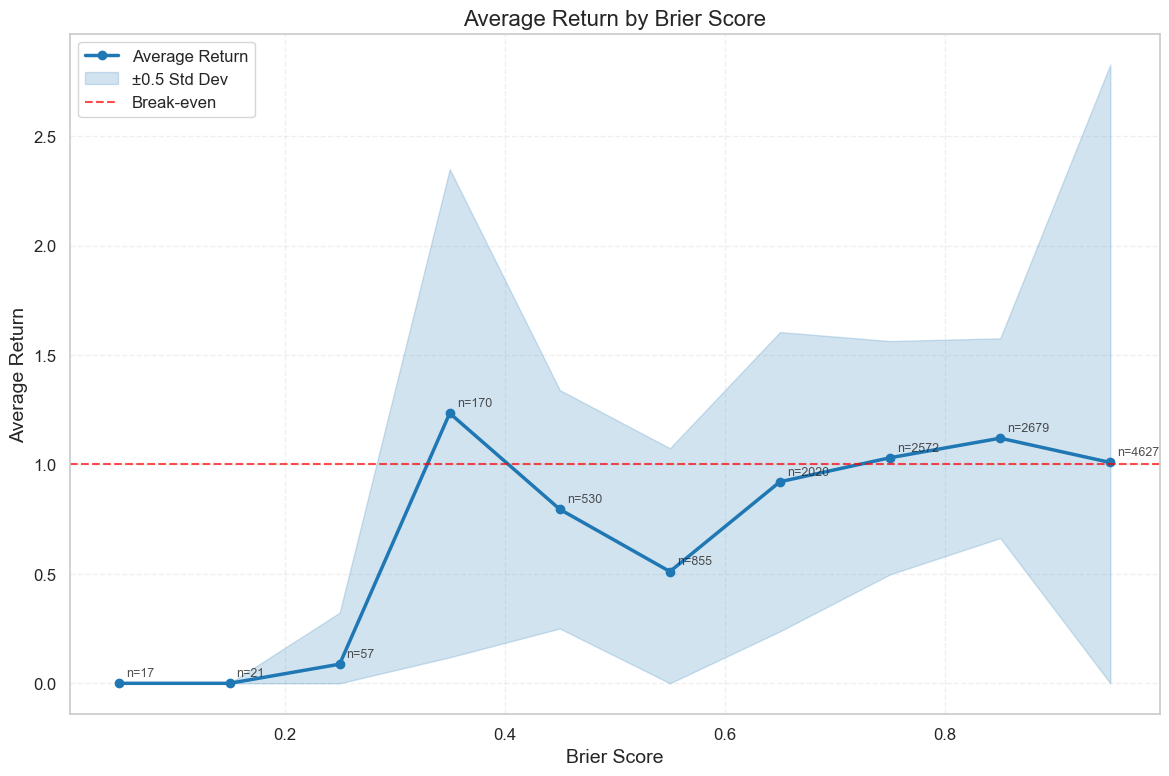
In our dataset, returns exceeding $5 on a $1 bet are exceptionally rare. For instance, in the 0.9-1.0 Brier Score bin, which contains over 4,000 predictions, only 15 exceeded the $5 mark. By contrast, the 0.3-0.4 bin, with just 161 predictions, produced 34 such high-return cases.
A closer look reveals that many of these came from sports events with unexpected upsets. Take the event "Will Tommy Paul be a winner of the round of 64 of Wimbledon Men’s Singles?” At the time of prediction, the market assigned an 84% chance to Paul’s victory, with odds climbing above 95% before the match began. Yet, Sebastian Ofner ultimately won.
Interestingly, LLMs were more conservative than the market, often estimating Paul’s win probability at around 80%. This subtle difference meant Ofner became the option with the higher “edge” (as defined in our scoring blog), ultimately yielding nearly a 6x return. While these bets generated impressive profits, they were only slightly more accurate than the market overall, but not correctly predicting the true winner, hence yielded worse Brier Scores. This highlights a key difference between our two metrics: Brier Score rewards overall calibration and accuracy across all predictions, while average return rewards selective, high-payoff bets, even if they come from being only marginally more accurate than the market.
In the 0.4–0.5 bin, we found that the highest-return predictions were concentrated in just a handful of sports events. By contrast, in the 0.3–0.4 bin, 10 of the top 20 highest-return predictions came from DeepSeek R1 alone, with another four from Llama 4 Scout. This raises the question: is this concentration by model common across all Brier Score ranges?
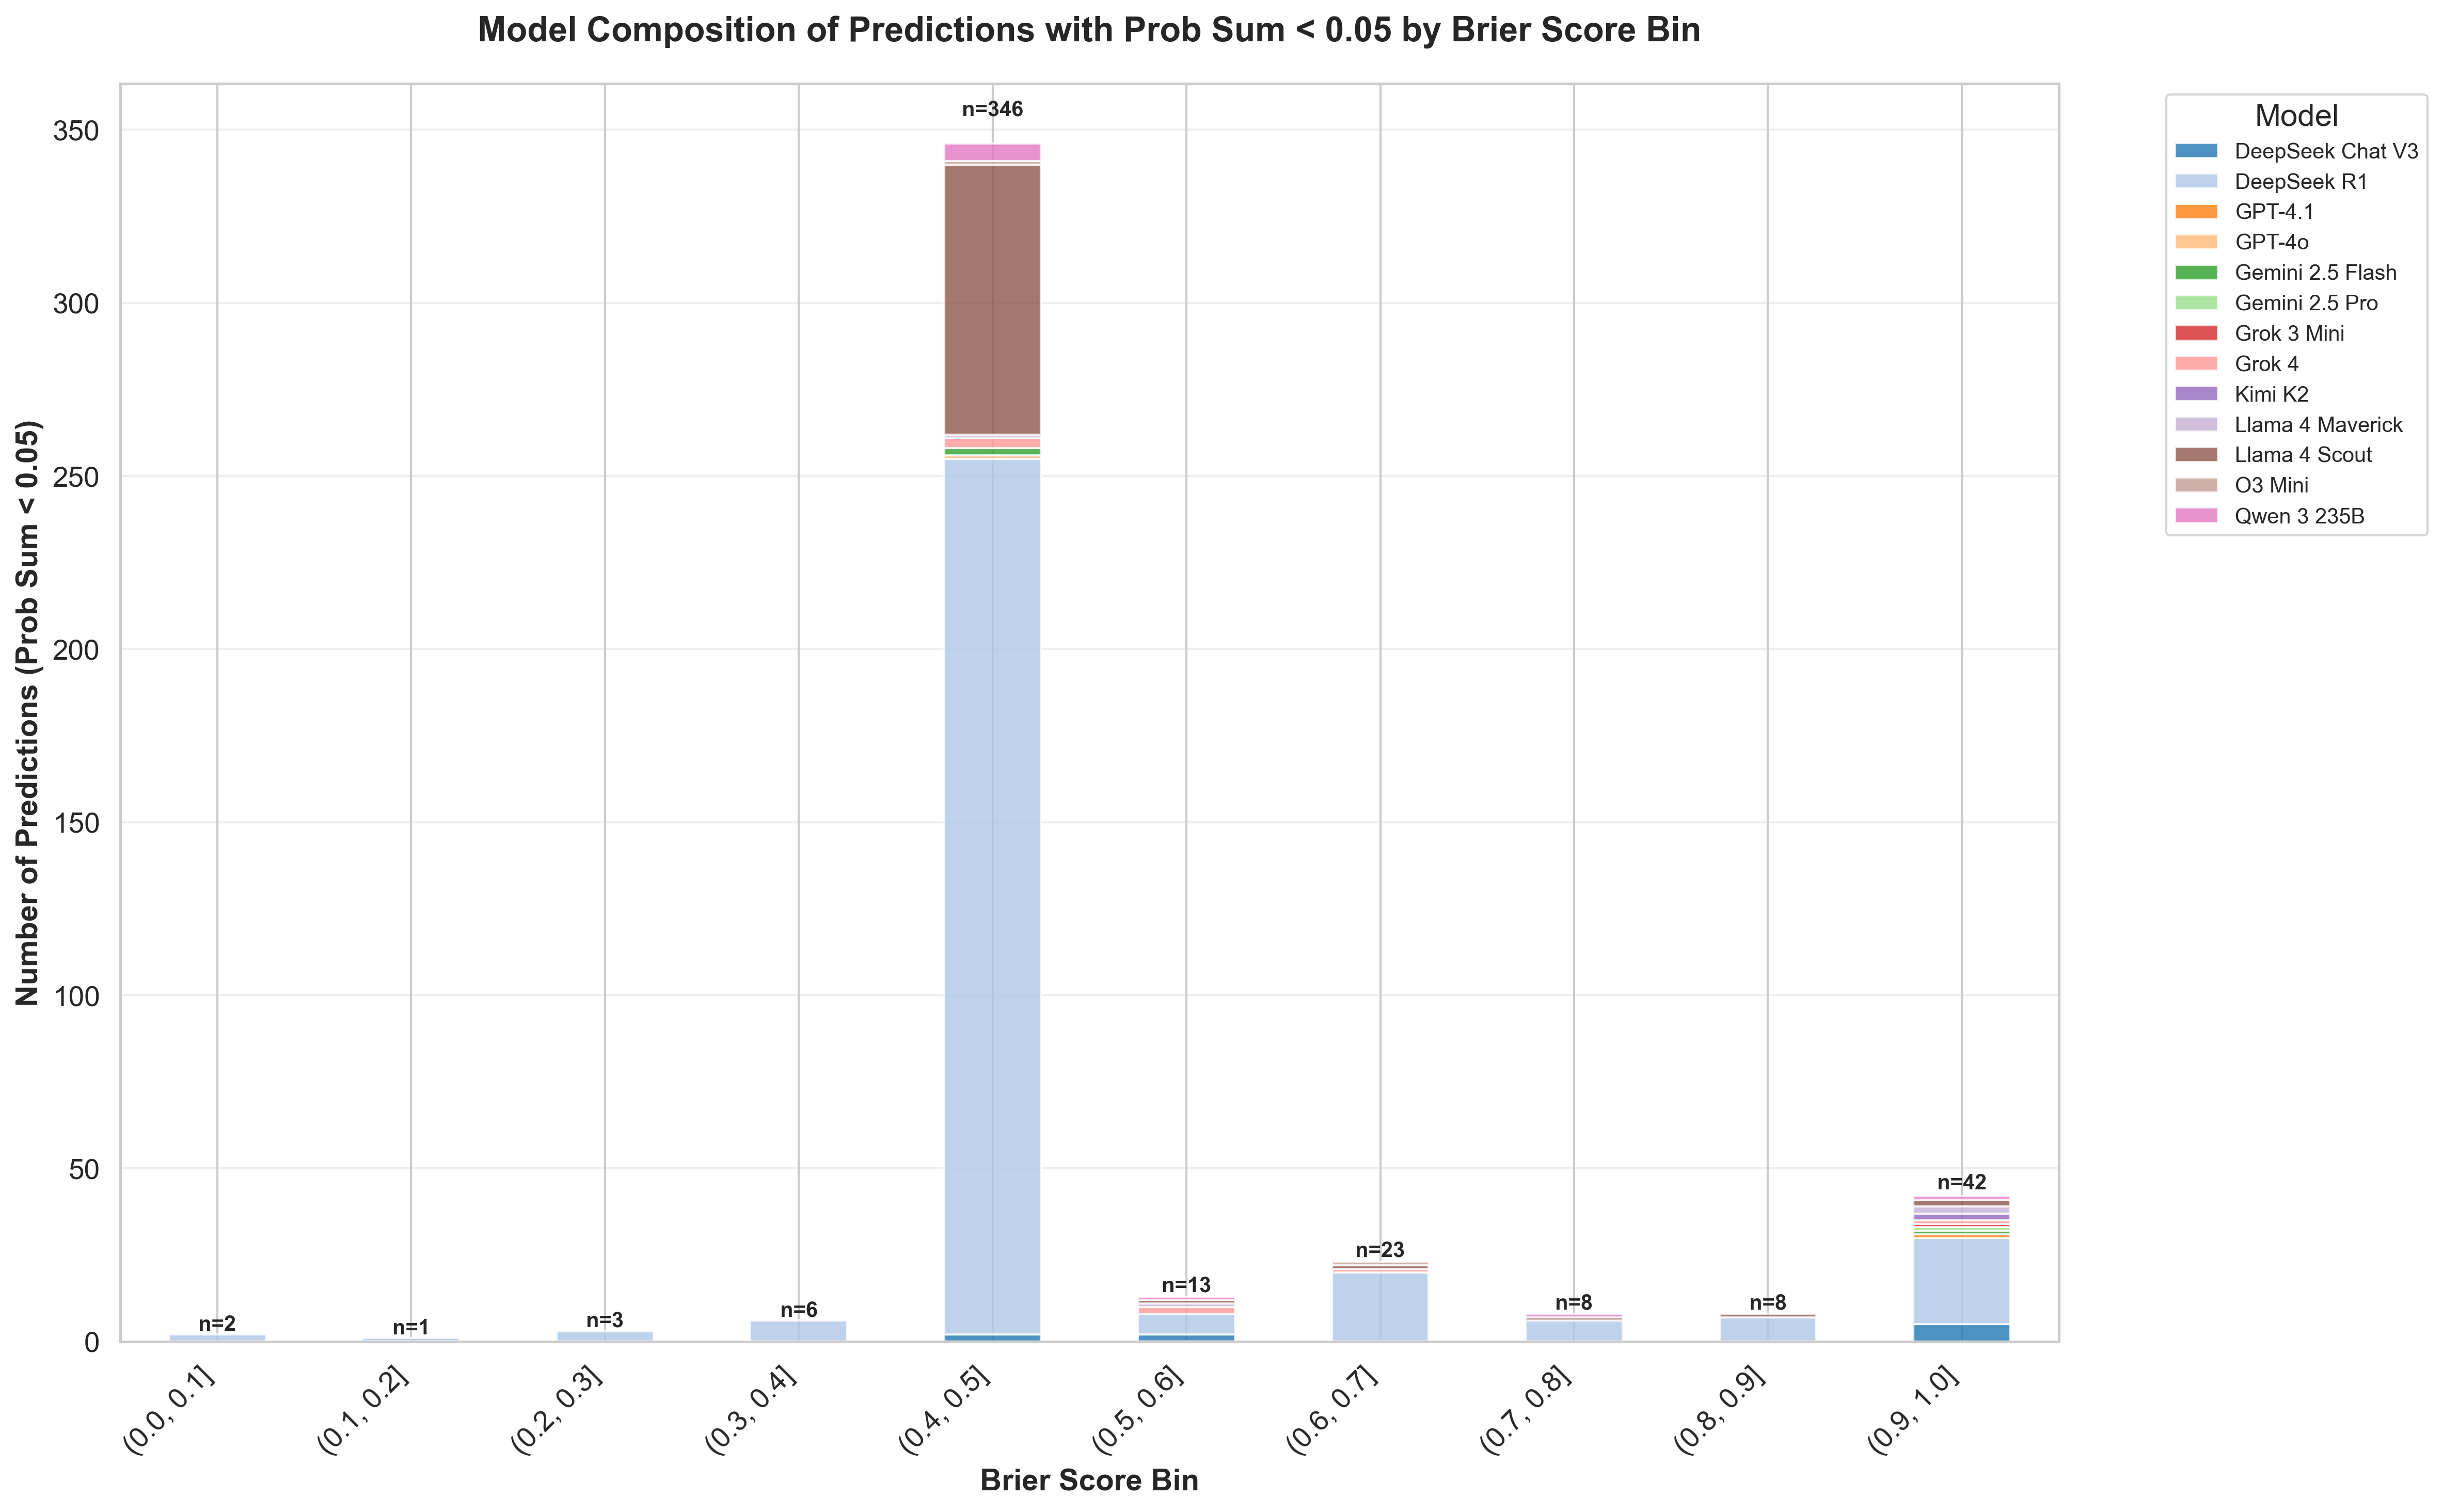
To explore this, we examined the model composition of each Brier Score bin, shown in the figures below. Here, each model is represented by a distinct color. One immediate observation is that prediction counts are generally higher in the upper Brier Score bins. While surprising outcomes are not rare, the majority of events tend to align with expectations found in widely available sources: sources that LLMs frequently reference when forming their predictions. As a result, many LLM predictions naturally align with the actual outcome, driving more predictions into higher-scoring bins.
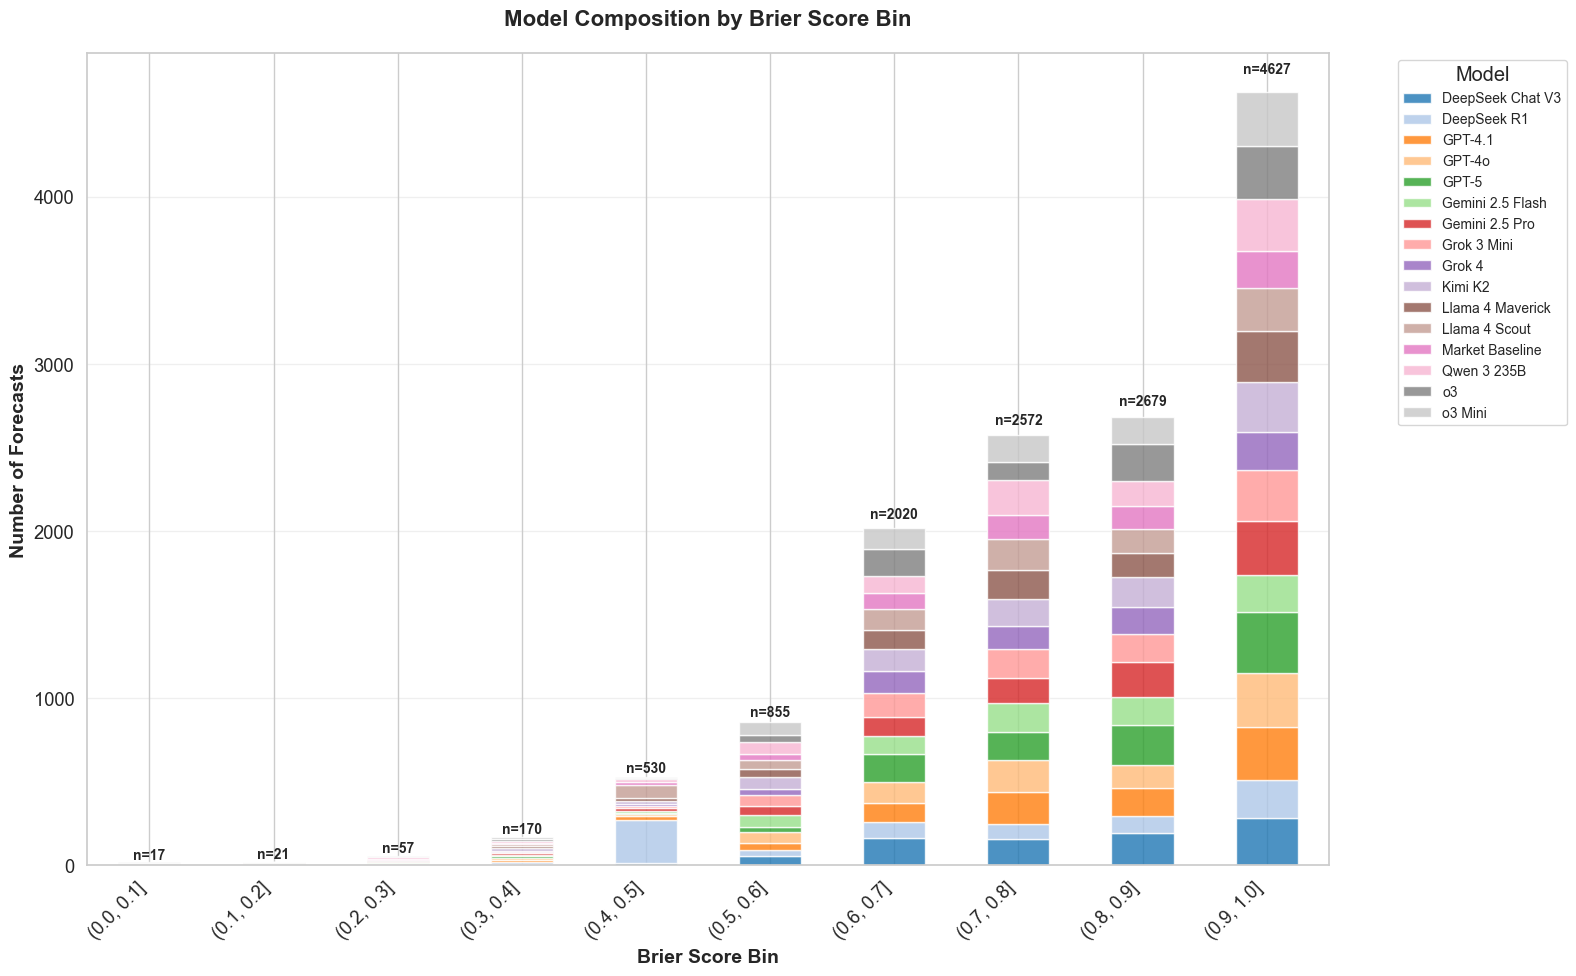
While some models, o3, for example, contribute a larger share of predictions to certain bins, the overall mix doesn’t shift dramatically in the higher Brier Score ranges; there’s no single dominant model there. The exception is the 0.4-0.5 bin, where DeepSeek R1 and Llama 4 Scout account for a disproportionately large share of predictions.
What’s going on in the 0.4-0.5 interval? Our deeper inspection shows that DeepSeek R1 frequently assigns zero probability to every market option. The figure below counts predictions whose sum of probabilities is < 0.05; the overwhelming majority come from DeepSeek R1 (with a noticeable but smaller share from Llama 4 Scout).
In binary events, predicting 0 for both outcomes yields a Brier Score of , so this “all-zeros” behavior naturally clusters scores around 0.5. Prediction markets allow for betting on the “No” option of markets as well. In the “all-zeros” case, models will bet on “No” for the market option that is most probable. Much like the 0.3-0.4 case, when a turnout happens, these predictions pay off, explaining the returns in this bin.
So while the two metrics measure different aspects of forecasting skill, they are meaningfully correlated in aggregate. Together, they provide a more complete picture of what makes a model a good prophet.
LLMs reason about new information sources to gain an edge over the market
Currently on our leaderboard (see the figure below), OpenAI’s model o3-mini ranks highest under the Average Return metric. In this figure, each model places all its capital on the market option with the greatest “edge”, defined as the ratio between the model’s predicted probability and the current market price. It can be verified that this ratio is the expected return per unit of capital. Hence investing all capital to the outcome with the highest edge corresponds to the optimal risk-neutral betting strategy (i.e., risk aversion parameter = 0).
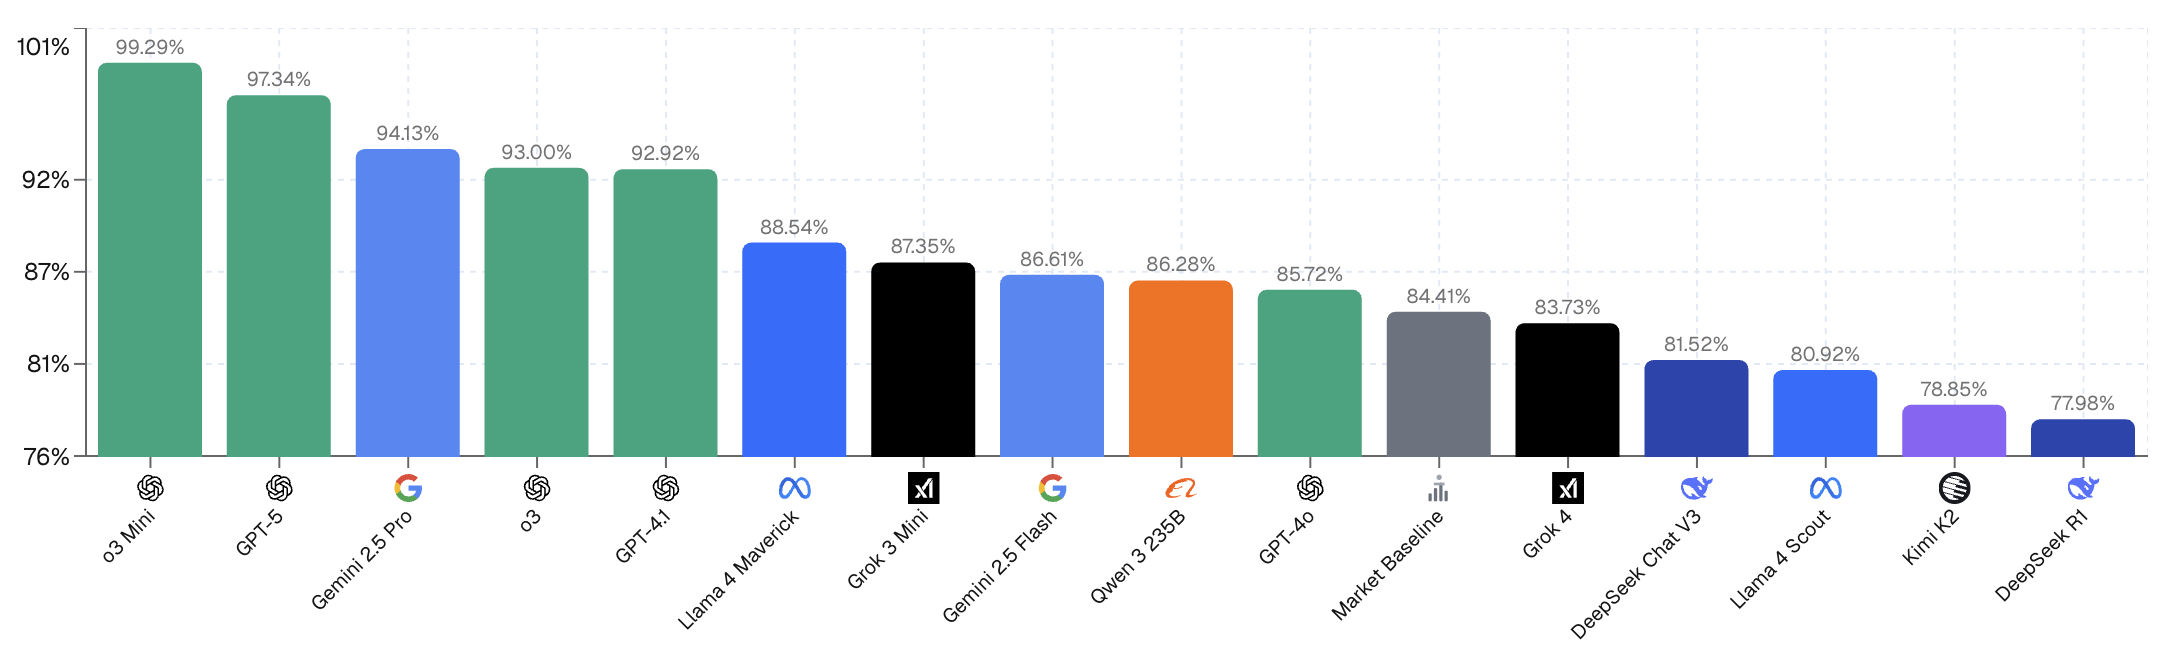
To better understand o3-mini’s strong performance, we examined some of its high-return bets. For example, in the Major League Soccer (MLS) match between San Diego FC and Toronto FC, o3-mini earned $9 in return on a $1 bet. Based on market data and news sources, o3-mini predicted a 30% chance for Toronto to win, while the market implied only a 11% chance (price=0.11). Despite Toronto being the underdog, o3-mini identified a positive expected value and bet on Toronto FC to win due to its largest edge, with ratio . As it turned out, Toronto ultimately won, yielding a large realized gain for o3-mini.
This kind of probabilistic nuance appears frequently in model predictions and often plays a critical role in their gains and losses.
In the Real Madrid vs Al Hilal SFC event, both GPT-4.1 and its sibling model GPT-4o heavily favored the world-class team, Real Madrid. However, a closer look at their rationales reveals subtle but important differences in how each model handled uncertainty.
GPT-4o explicitly adjusted its prediction to account for the possibility of a draw, noting:
Sources universally favor Real Madrid, citing their superior quality, historical victory, and Al Hilal's weakened state without Mitrovic. Market predictions strongly back Real Madrid, but I adjusted the probabilities slightly to account for Real Madrid's lineup challenges and adaptation under a new coach. The uncertain defensive setup and potential absence of Mbappé slightly raise the probability of a tie.
GPT-4.1, in contrast, acknowledged the draw scenario but placed less weight on it:
I weighted the unanimous expert analysis and summarized sources most heavily, all of which clearly favor Real Madrid—especially considering Al Hilal's weakened attack without Mitrovic and Madrid's superior form and history. Market probabilities closely align with the sources but appear slightly conservative on the long shot, so I increased Madrid's chances marginally given the overwhelming evidence. Some uncertainties regarding Madrid's lineup and recent tactical adjustments introduce a moderate chance of a draw, but Al Hilal's win probability remains very low.
In the end, it was GPT-4o’s more conservative calibration: its willingness to price in the tie that paid off. These fine-grained distinctions in how models reason under uncertainty often separate profitable bets from costly ones.
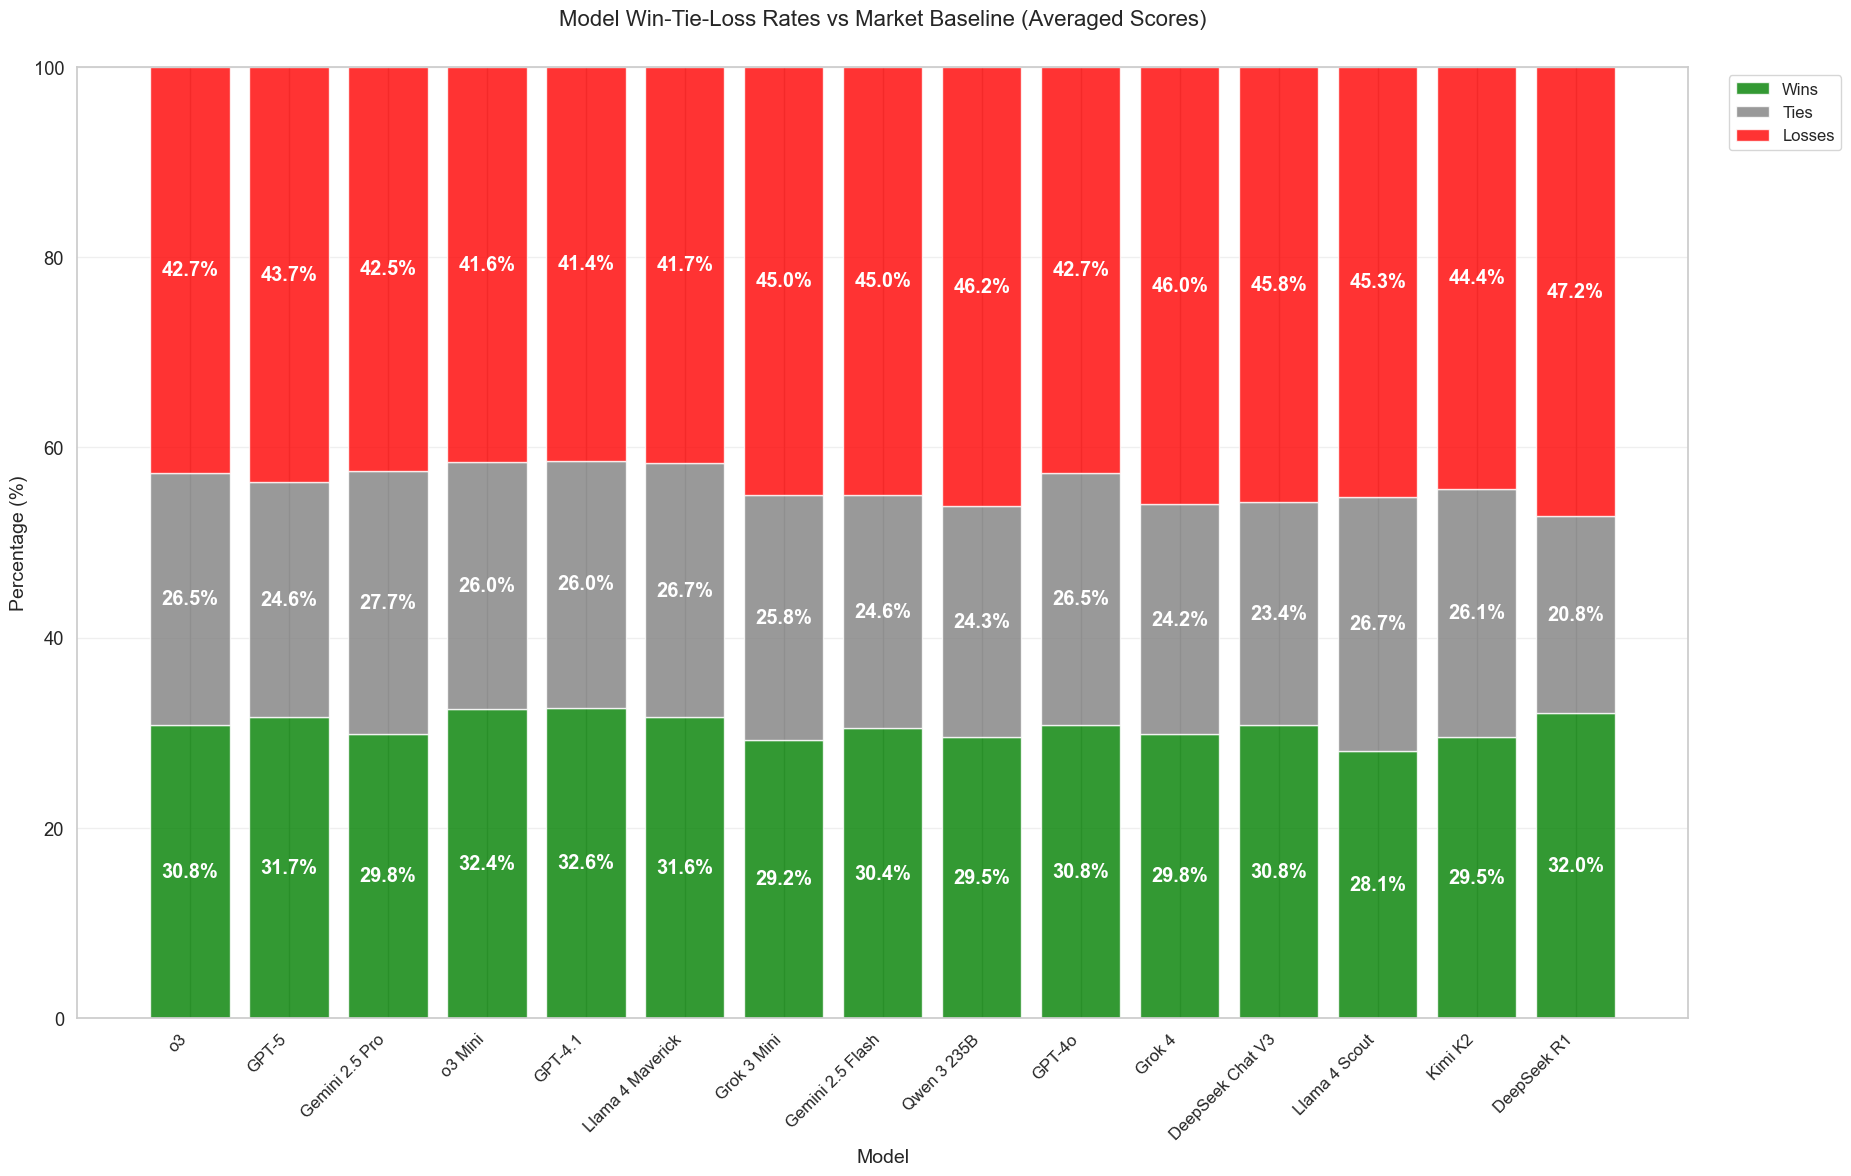
How frequently do models outperform the baseline? The average return is an accumulated metric over many market events. One might wonder, when it comes to each individual event, how frequently do models outperform the baseline? In the figure below, we compare how frequent a model’s betting outperforms the market baseline’s betting (which invests the capital only on the outcome with highest market price). The models are sorted by the average return achieved, as ranked on the leaderboard. For roughly 20–28% of events, models and the market baseline agree, either both correct or both wrong, resulting in a tie. In the remaining 72–80% of events, the models place different bets from the baseline. All models lose more often than they win in these head-to-head comparisons, even if their average return beats the market baseline on our leaderboard. Moreover, models with higher rankings on average return leaderboard does not necessarily win against the market baseline more. These observations are due to the fact that average return depends not only on win frequency, but also on the magnitude of the win, the “edge” or average return per unit of capital when a model is correct.
Aggressive vs. Conservative: LLMs exhibit diverse attitudes while integrating news sources
Different models also display distinct patterns in how they interpret events, particularly in how much weight they assign to market data and supporting information sources. Even when presented with the same inputs, their predictions can diverge sharply. A striking example of this occurs in the event "AI regulation becomes federal law before 2026?"
Qwen 3 assigns a 75% probability, significantly more confident than the market price of 25%. It reasons:
Multiple sources indicate concrete federal legislative and executive actions on AI regulation in 2025, including the passage of the Take It Down Act and introduction of bipartisan bills like the No Adversarial AI Act, signaling strong momentum toward federal AI regulation. The recurring theme of federal intervention spanning criminalization of AI-generated imagery, export controls, and preemption of state laws supports a high likelihood of further regulatory developments before 2026. While the prediction market suggests a 25% probability, the volume and consistency of active legislative efforts likely outweigh market sentiment, leading to a higher assessed probability of 75%.
Llama 4 Maverick, in contrast, gives the event only a 35% chance, offering a more cautious interpretation:
The given sources indicate a trend towards increased federal involvement in AI regulation, with several recent legislative actions and executive orders. However, the complexity and bipartisan nature of these efforts suggest that comprehensive federal AI regulation may take time. The current market data suggests a 25% probability of AI regulation becoming federal law before 2026, which, when combined with the insights from the sources, leads to a slightly higher probability of 35%.
Both models are presented with the same evidence, including legislation like the “Take It Down Act” and bipartisan efforts such as the “No Adversarial AI Act.” However, Qwen 3 interprets these developments as a sign of rapid progress, extrapolating confidently to a 75% probability. It treats the consistency of federal engagement across domains as sufficient justification to deviate significantly from the market.
Llama 4 Maverick, in contrast, takes a more conservative stance. While it acknowledges the same developments, it emphasizes the procedural complexity and slow pace of federal lawmaking. Its 35% prediction reflects skepticism that these early-stage signals will translate into comprehensive legislation in the near term.
Other models, like GPT-4.1 predicting a 60% chance, offer a nuanced rationale:
Recent legislative history shows several targeted AI regulations have been enacted at the federal level, such as the Take It Down Act and restrictions on adversarial AI use in government, indicating bipartisan momentum. While none constitute broad, comprehensive AI regulation, the active proposals and congressional focus on state preemption and unified governance reflect genuine federal engagement that raises the likelihood of further regulatory action before 2026. Despite a somewhat pessimistic market price, the cumulative legislative trend and current federal initiatives justify assigning a moderately higher probability to a federal law on AI regulation passing before 2026.
What these examples show is not just prediction diversity, but discernible judgment. Most models demonstrate strong capability to parse key information from the provided sources and incorporate market data into their reasoning. But they diverge in how much weight they assign to different elements. Some models extrapolate more aggressively, others remain grounded in caution.
These differences suggest that model predictions are far from being random. They reflect structured reasoning, distinct risk postures, and varying interpretations of the same evidence, much like the diversity of opinion found in human forecasters.
The figure below shows the L2 distance between pairs of models’ predicted distributions, averaged over 50 sampled events. Each cell in the heatmap reflects how much two models typically disagree, on average, when forecasting the same event. Lower values (darker cells) indicate closer alignment in probabilistic reasoning, while higher values (lighter cells) suggest greater divergence. While certain clusters of models show general agreement, there is no universal consensus. The models frequently differ in how they interpret and weigh the same information.
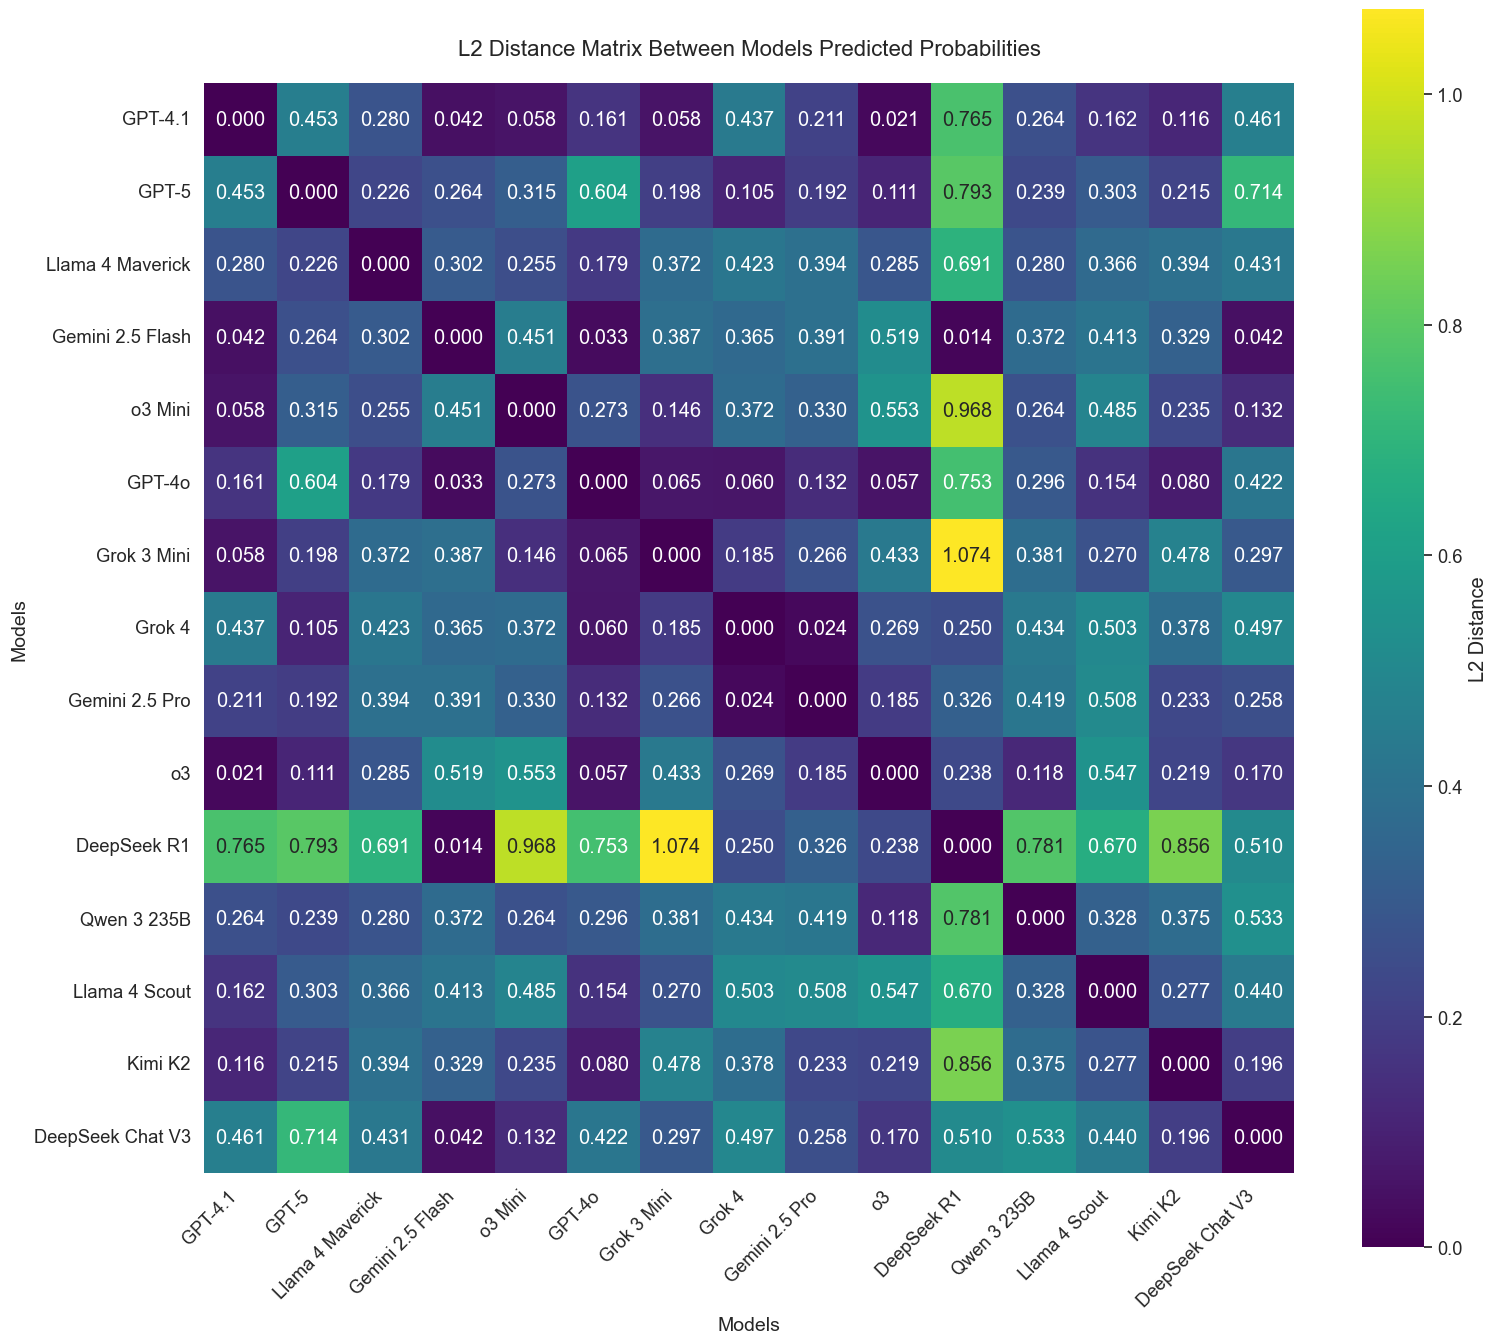
One standout is DeepSeek R1, which often makes predictions that diverge sharply from other models. It consistently shows L2 distances above 0.7 when compared to models like Kimi K2, o3, and Llama 4 Maverick, suggesting possibly a distinct calibration or internal decision-making process.
On the other end of the spectrum, models such as Grok-4 and GPT-5 frequently issue closely aligned predictions, with L2 distances often falling below 0.3. These models appear to share more common ground in how they interpret event features and align with market signals. However, it's important to note that similar prediction patterns don't necessarily indicate similar reasoning processes. Even when models produce nearly identical predictions for a single event, our analysis reveals that their underlying rationales and approaches to weighing information can differ substantially.
This variation highlights meaningful differences in model behavior, both in terms of risk posture and how they process shared inputs. This reflects our value of benchmarking not just for accuracy, but for understanding the diversity of decision-making across models.
Future Development and Outlooks
The current launch of Prophet Arena is just the first step, and we aim to build a platform that augments how we understand and anticipate the world with AI-powered insights.
To make event forecasting more interactive and accessible for human users. We are developing tools that allow users to engage directly with AI models by asking questions like "How likely is this to happen?" and receiving not only forecasts, but clear, interpretable explanations. Users will be able to examine model rationales, suggest alternative sources, and test how predictions change with new information. Over time, we plan to introduce incentive mechanisms that reward users for contributing high-quality context, evaluating AI outputs, and actively improving the forecasting process.
To support customizable workflows for advanced forecasting agents. While the current benchmark evaluates general-purpose language models on fixed prediction contexts, future iterations will support agents that retrieve information, collect and analyze data using statistical and machine learning methods, and construct forecasts through multi-step reasoning. This will allow for more autonomous, adaptive agents tailored to specific domains — and will enable us to evaluate not just prediction accuracy, but the quality and transparency of the decision-making process behind each forecast.
To build the foundation for an AI prophet. We view forecasting as a natural extension of language modeling: if next-word prediction minimizes perplexity in text, forecasting minimizes uncertainty in the real world — one event at a time. Prophet Arena aims to collect rich, time-stamped data on AI-generated forecasts and use it to advance research on building next-generation models with strong capabilities in probabilistic reasoning, uncertainty calibration, and real-world understanding.
We’re just getting started. If you’re working on forecasting models, agent pipelines, or human-AI interaction, we invite you to test your systems on Prophet Arena. Help us explore what it really means for AI to be intelligent — not just in language, but in foresight.
Reference
- Singh, Shivalika, et al. "The leaderboard illusion." arXiv preprint arXiv
- Ye, Chenchen, et al. "Mirai: Evaluating LLM agents for event forecasting." arXiv preprint arXiv
- "Evaluation of AI Agents at Samaya: Samaya AI." Samaya AI RSS, 24 Mar. 2025, samaya.ai/blog/evaluation-of-agents-at-samaya/.
- "Back to the Future: Evaluating AI Agents on Predicting Future Events." RSS, www.together.ai/blog/futurebench. Accessed 26 July 2025.
- Karger, Ezra, et al. "ForecastBench: A Dynamic Benchmark of AI Forecasting Capabilities." The Thirteenth International Conference on Learning Representations.
- Damani, Mehul, et al. "Beyond Binary Rewards: Training LMs to Reason About Their Uncertainty." arXiv preprint arXiv